GRAPHICS_EXAMPLES is a dataset directory which contains examples of data used to illustrate or test various graphics procedures for presenting and analyzing data.
The computer code and data files described and made available on this web page are distributed under the GNU LGPL license.
GRAPHICS_EXAMPLES programs are available in a C version and a C++ version and a dataset version and a FORTRAN77 version and a FORTRAN90 version and a MATHEMATICA version and a MATLAB version and a Python version.
CITIES, a dataset directory which contains sets of information about cities and the distances between them;
DOUBLE_C_DATA, MATLAB programs which generate, plot or write out 2D data that forms two interlocking "C" shapes.
DRAFT_LOTTERY, a dataset directory which contains the numbers assigned to each birthday, for the Selective Service System lotteries for 1970 through 1976.
GRAPHICS_EXAMPLES_CONVERT, examples which illustrate how various kinds of data can be processed and modified using the ImageMagick program convert() and its related tools.
GRAPHICS_EXAMPLES_GNUPLOT, examples which illustrate how various kinds of data can be displayed and analyzed graphically using the interactive executable graphics program gnuplot().
GRAPHICS_EXAMPLES_GRACE, examples which illustrate how various kinds of data can be displayed and analyzed graphically using the interactive executable graphics program grace().
GRAPHICS_EXAMPLES_PLOTLY1, examples which illustrate how various kinds of data can be displayed and analyzed graphically, using version 1 of the plotly() program from a browser.
MARTINEZ, a dataset directory which contains datasets for computational statistics, including cluster analysis;
MDS, a dataset directory which contains datasets for M-dimensional scaling;
REGRESSION, a dataset directory which contains datasets for testing linear regression;
SPAETH, a dataset directory which contains datasets for cluster analysis;
SPAETH2, a dataset directory which contains datasets for cluster analysis;
TIME_SERIES, a data directory which contains examples of time series, which are simply records of the values of some quantity at a sequence of times.
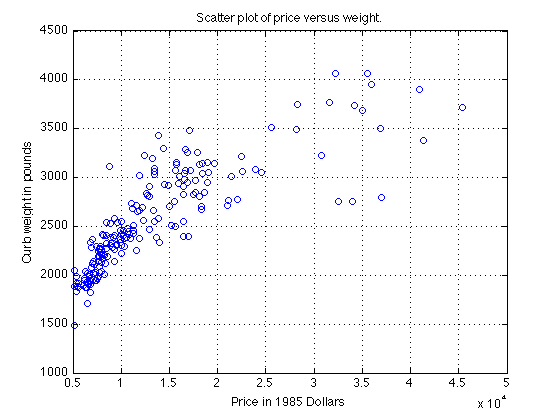
AUTOMOBILE contains 205 records, with 26 attributes, describing properties of cars available in 1985, taken from the UCI Machine Learning Repository. The attributes are separated by commas. Some attribute values are missing, and in this case a question mark '?' appears for the value. The attributes include:
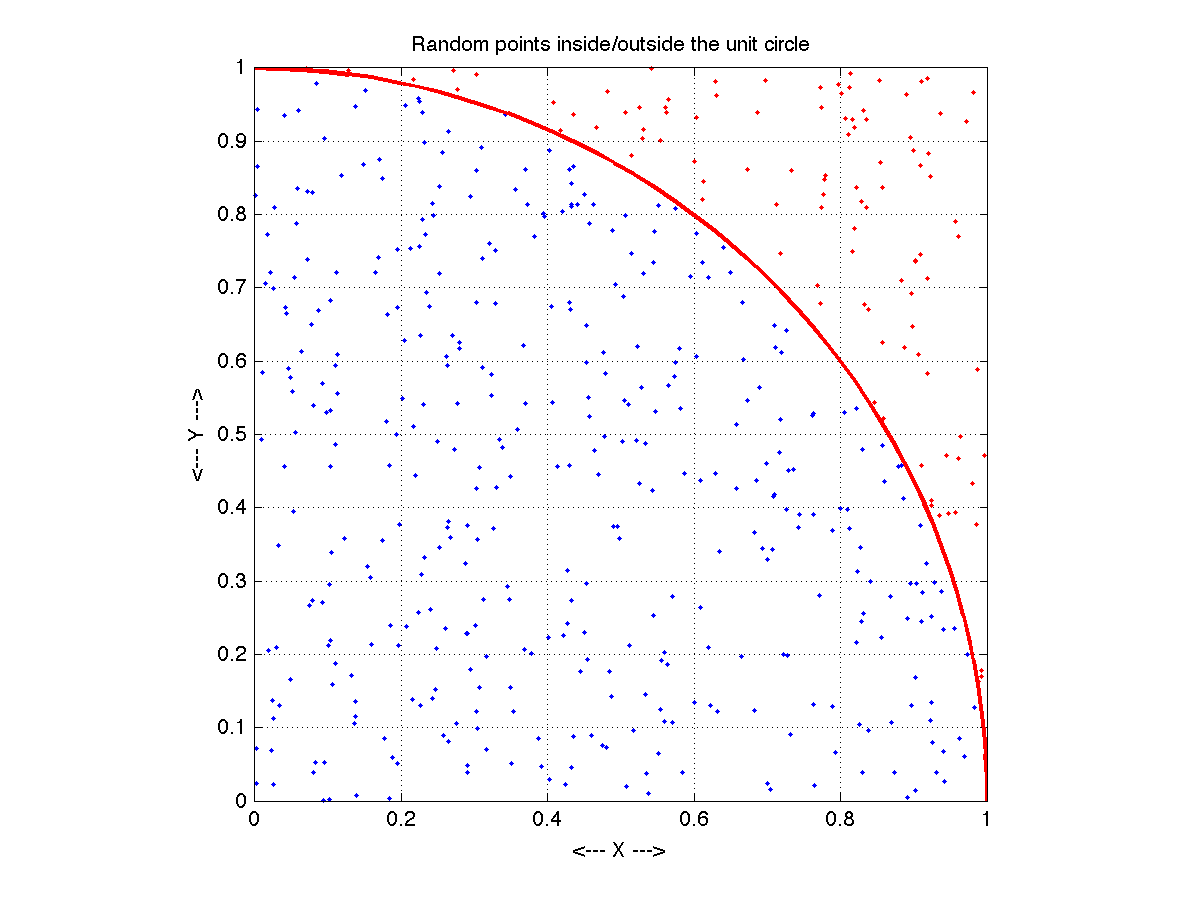
CIRCLE_INOUT depicts 500 pairs of (X,Y) data points in the unit square, 395 of which lie inside the unit circle, and 105 outside. If possible, the "inside" points should be blue, the "outside" points red, and the circle itself should also be drawn.
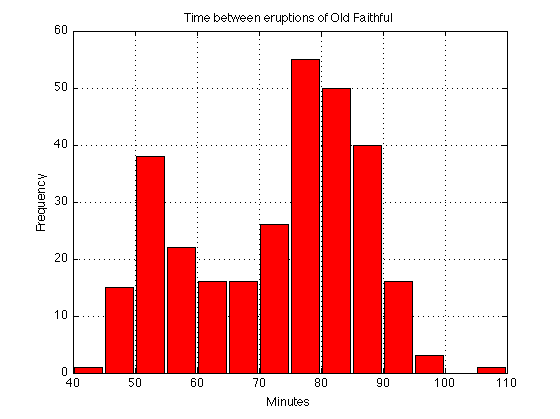
GEYSER contains the waiting time in minutes between successive eruptions of the Old Faithful geyser. 299 values are recorded. The data ranges from 43 to 108. It should be displayed in 14 bins of width 5 from 40 to 110. The data comes from Martinez and Martinez.
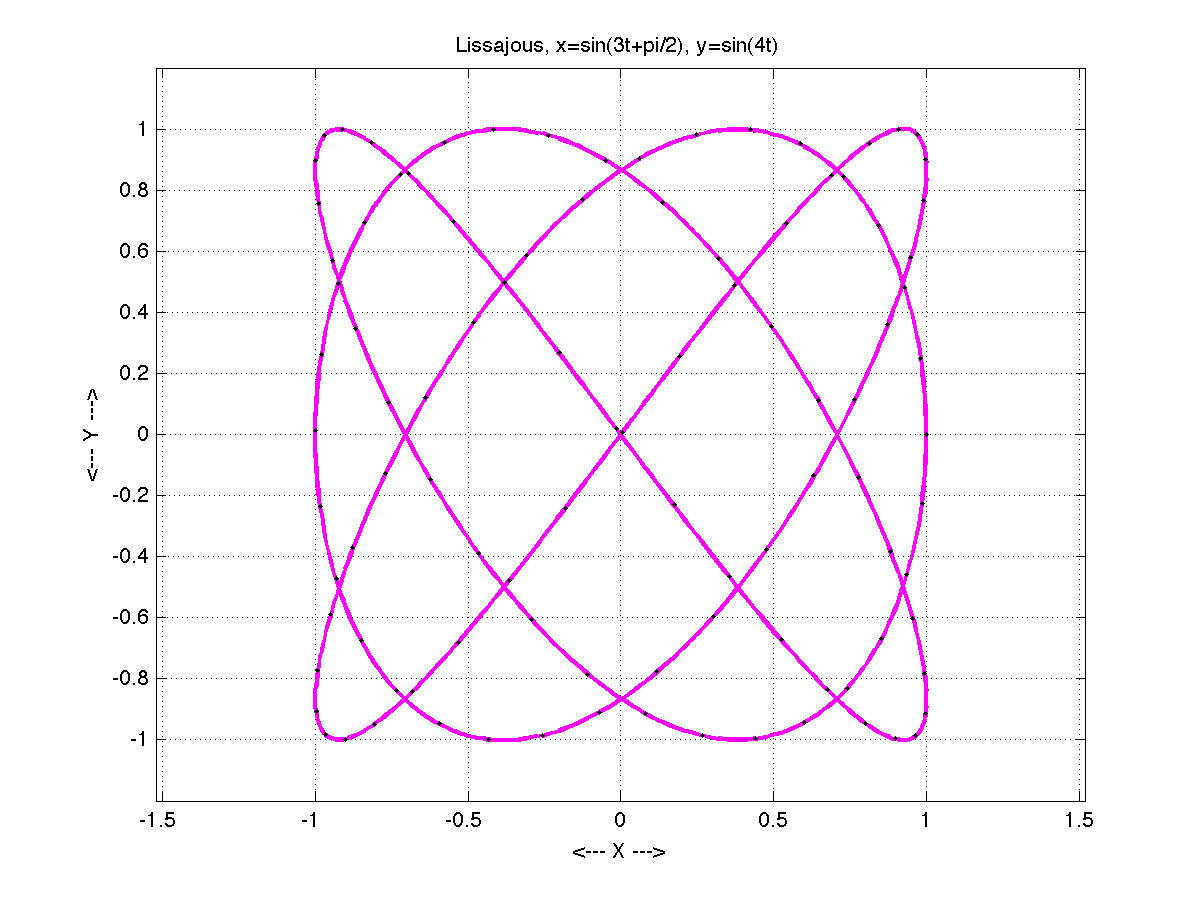
LISSAJOUS records 1000 points on a Lissajous curve defined by x=sin(3*t+pi/2), y=sin(4t). The curve is to be plotted and every tenth point marked.
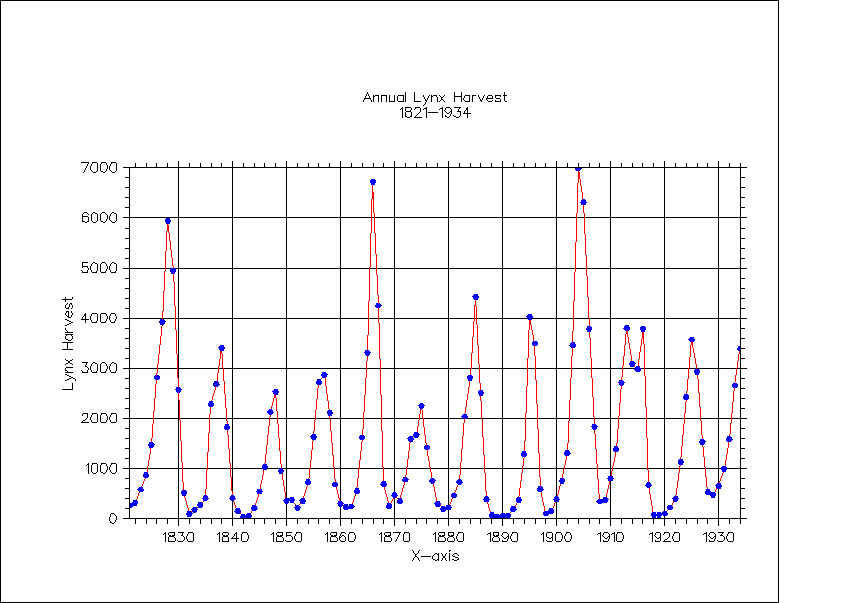
LYNX records the yearly lynx harvest from 1821 to 1934. The graph should plot the data points as circles, and connect consecutive data points with straight line segments to suggest a curve.
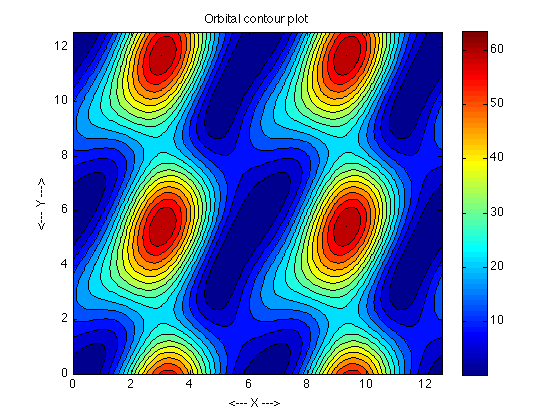
ORBITAL records, on a 101x101 grid over [0,4*pi]x[0,4*pi], the minimum distance between two planets given a pair of orbital angles. A contour plot of this data is to be presented.
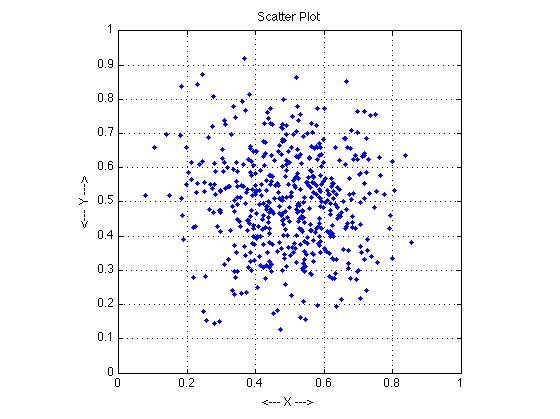
SCATTER_PLOT is a set of 500 pairs of (X,Y) data, which lie in the unit square, and tend to cluster around (0.5,0.5).
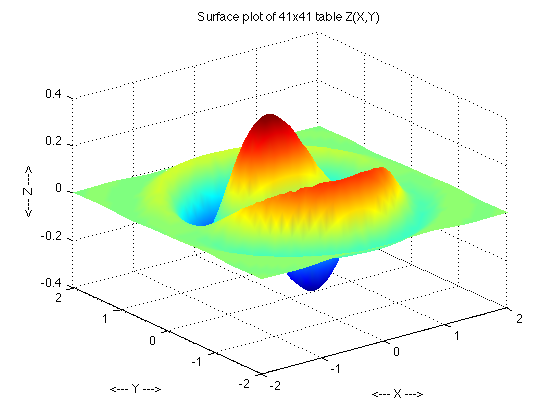
SURFACE_GRID records, on a 41x41 grid over [-2,2]x[-2,+2], the values z = exp(-(x^2+y^2)) * cos(0.25*x) * sin(y) * cos(2*(x^2+y^2)). The data is to be plotted as a surface.
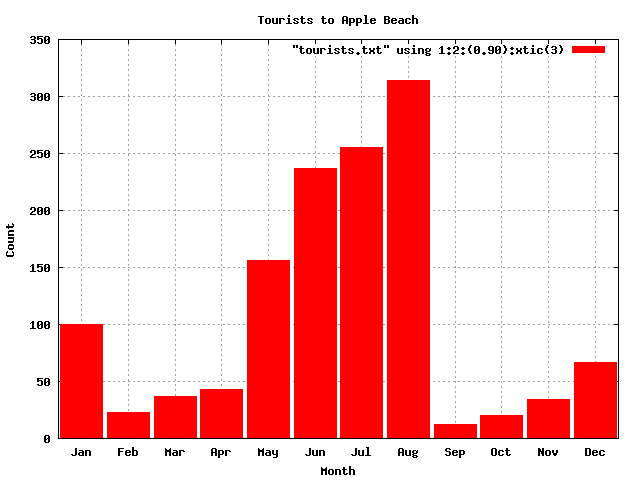
TOURISTS contains the number of tourists to Apple beach each month. The file contains 12 records, with each record listing the index (1-12) of the month, the number of tourists, and a 3 letter month abbreviation. The data should be displayed as a histogram, and the month abbreviation should appear below each bar.
You can go up one level to the datasets directory.