TIME_SERIES is a data directory which contains examples of files describing time series.
A time series is simply a sequence of values of a time dependent quantity. Often, the samples are taken at a constant time interval. Examples of time series include the Dow-Jones stock index, the daily noon temperature reading at the Roanoke airport or the yearly estimate of Mexico's population.
Given a time series, there are some natural tasks that might arise, including interpolation (estimating values at intermediate points), integration (estimating the area below the curve from which the samples were taken) or Fourier analysis (searching for underlying "rhythms" or "tides" or natural cycles that compose a significant portion of the observed data).
The computer code and data files described and made available on this web page are distributed under the GNU LGPL license.
FFTPACK5, a FORTRAN90 library which implements the Fast Fourier Transform.
FFTW3, C programs which illustrate the use of the FFTW3 library for Fast Fourier Transforms.
NMS, a FORTRAN90 library which includes a wide variety of numerical software, including solvers for linear systems of equations, interpolation of data, numerical quadrature, linear least squares data fitting, the solution of nonlinear equations, ordinary differential equations, optimization and nonlinear least squares, simulation and random numbers, trigonometric approximation and Fast Fourier Transforms.
SFTPACK, a C++ library which implements the "slow" Fourier transform, intended as a teaching tool and comparison with the fast Fourier transform.
STATS, a dataset directory which contains datasets for computational statistics;
MAKE_PLOTS is a MATLAB script that generates some of the plots.
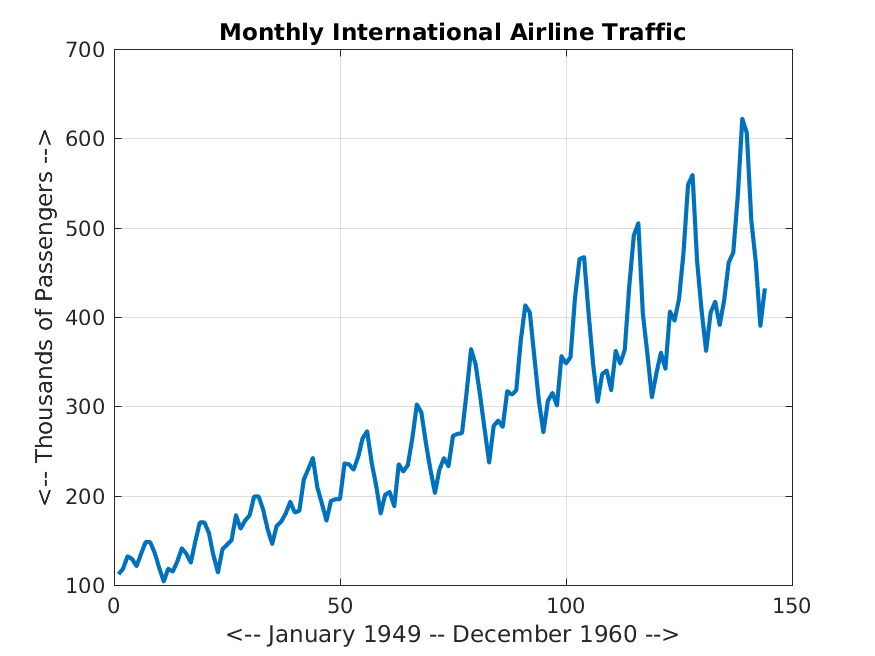
AIRLINE_PASSENGERS is a table of 3 columns and 144 rows. Column 1 is the year, from 1949 to 1960, column 2 is the month, from 1 to 12, and column 3 is the number of international airline passengers in thousands. This data was presented as series G by Box, Jenkins and Reinsel, 1976.
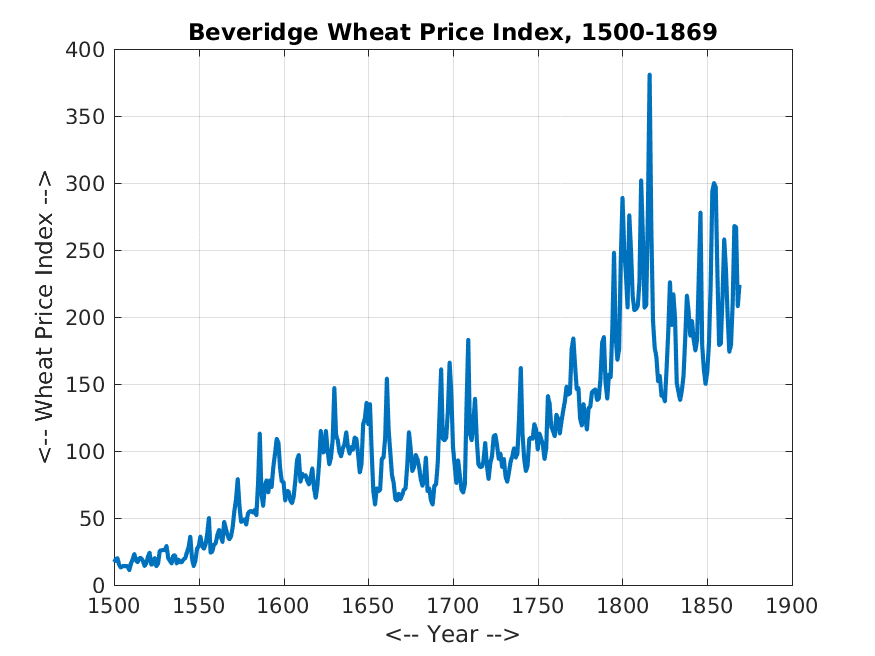
BEVERIDGE_WHEAT is a table of two columns. Column 1 is the year, from 1500 to 1869. Column two is an averaged price for wheat. This data was presented by Beveridge, 1921.
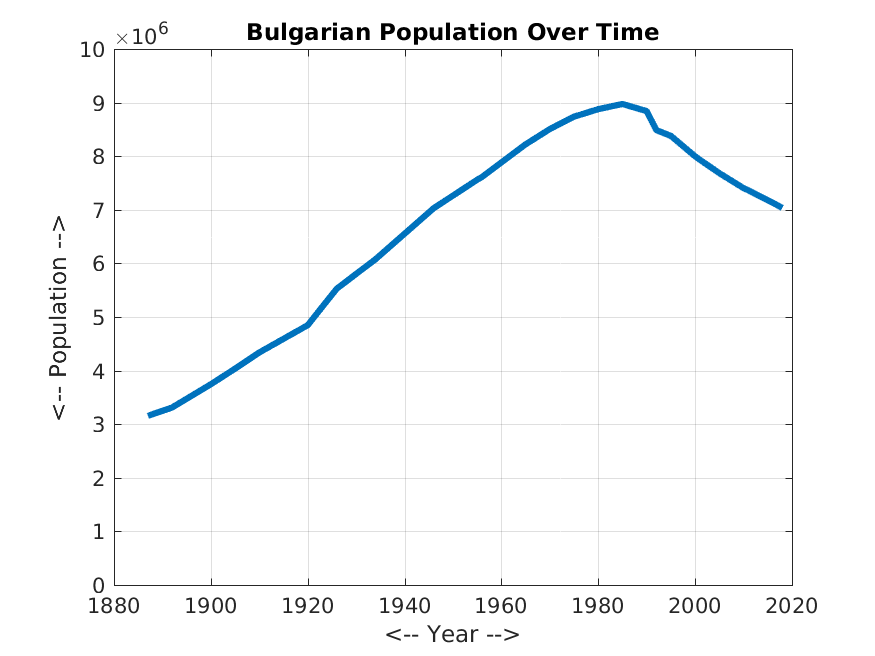
BULGARIA plots the Bulgarian population over time.
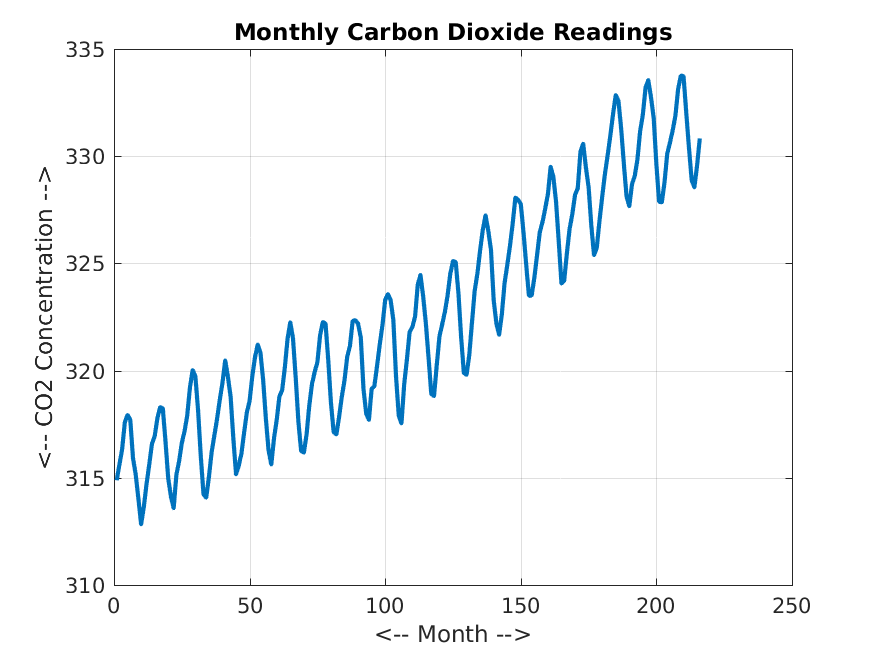
CO2 is a table of three columns. Column 1 is a month index which simply runs from 1 to 216; column 2 is the measured level of carbon dioxide; column 3 is the month and year of the reading, from 1/58 to 12/75. This data was derived from the book by David Kahaner, Cleve Moler, and Stephen Nash, "Numerical Methods and Software".
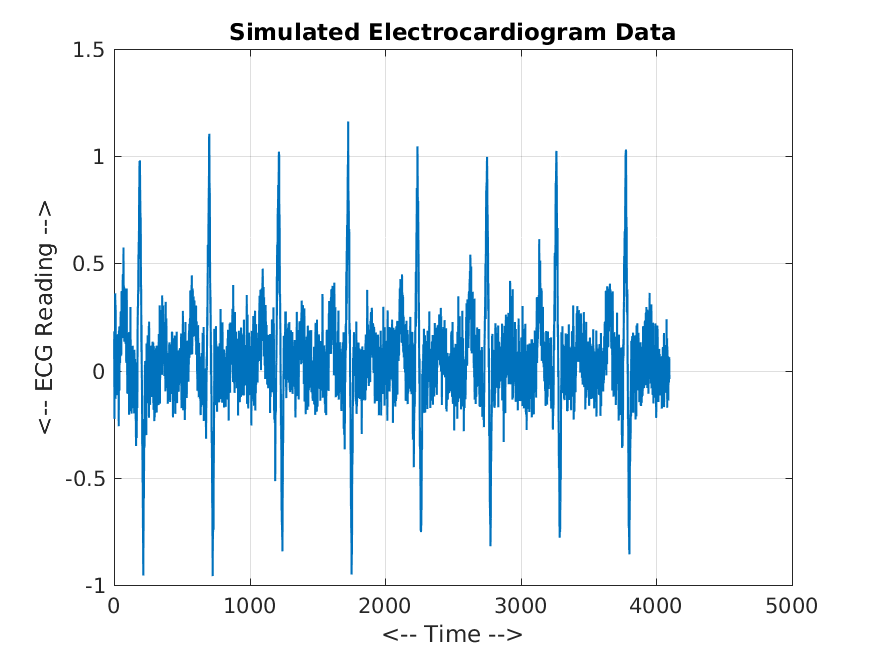
ECG is a list of 4096 simulated measurements of an electrocardiogram signal, over 8 cycles. The data was generated in MATLAB using the commands x = ecg(512); x = repmat ( x, 1, 8 ); x = x + 0.1 * randn ( 1, length ( x ) );
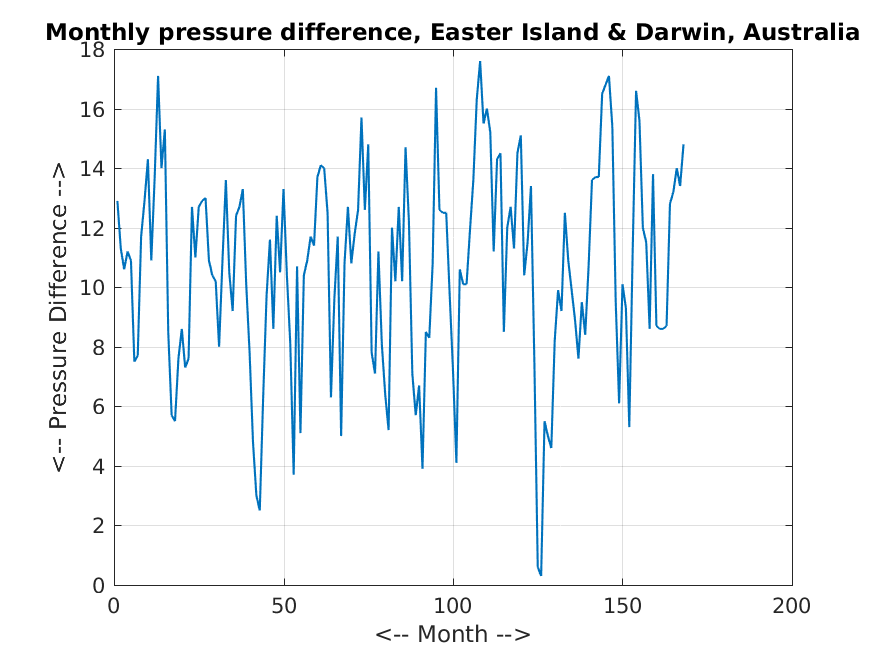
EL_NINO is a table of two columns. Column 1 is a month index which simply runs from 1 to 168; column 2 is the difference in atmospheric pressure between Easter Island and Darwin, Australia, measured at sea level at the same moment each month. This data was derived from the book by David Kahaner, Cleve Moler, and Stephen Nash, "Numerical Methods and Software".
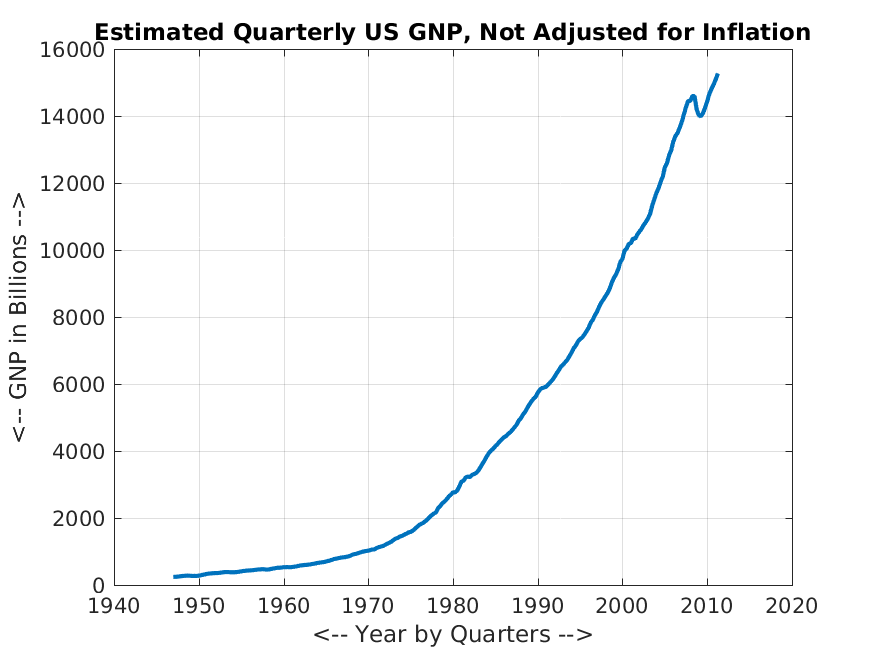
GNP is a list of 258 estimates of the quarterly gross national product for the United States, from 1947 to 2011. Column 1 is the data, presented as a decimal year, from 1947.00 to 2011.25. Column 2 is the quarterly GNP estimate in billions of dollars, not adjusted for inflation. The data comes from the US Department of Commerce, and is explained at http://www.bea.gov/national/pdf/nipaguid.pdf.
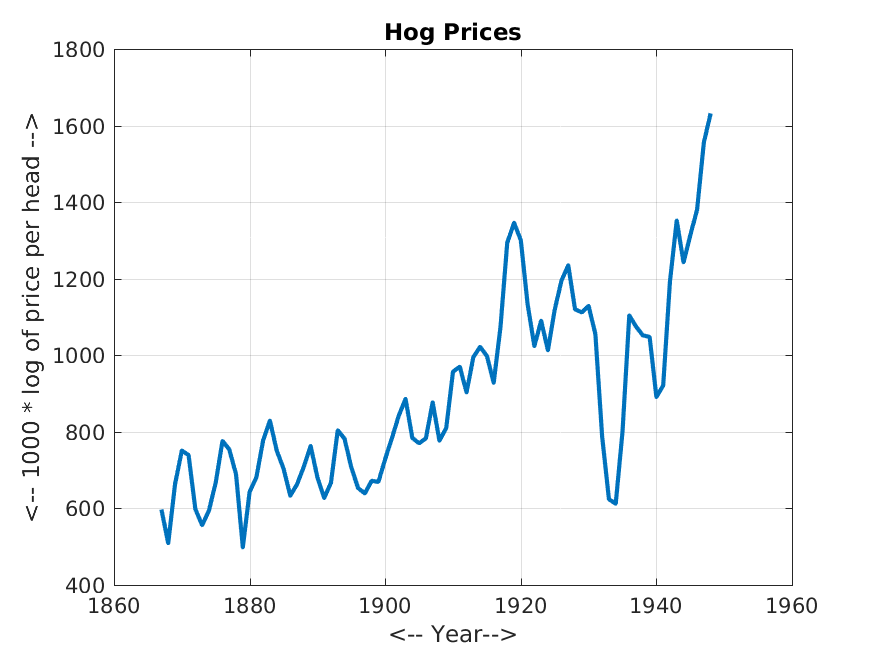
HOG_PRICE is a table of 2 columns and 82 rows. Column 1 is the year, from 1867 to 1948, and column 2 is the 1000 times the logarithm of the price per head on January 1. This data was presented as series Q by Box, Jenkins and Reinsel, 1976.
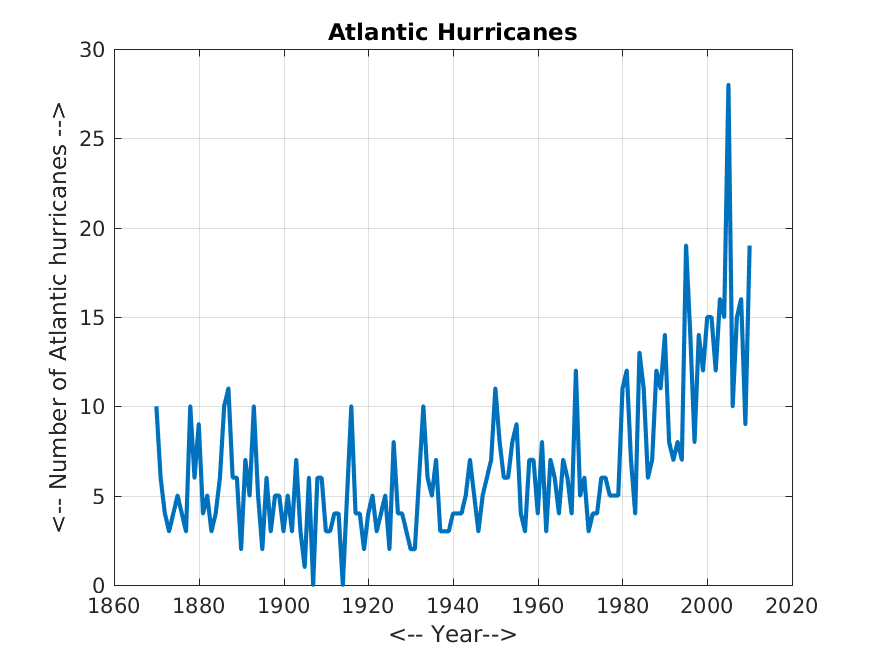
HURRICANES is a table of two columns. Column 1 is the year, between 1870 and 2010, and column 2 is the number of Atlantic hurricanes.
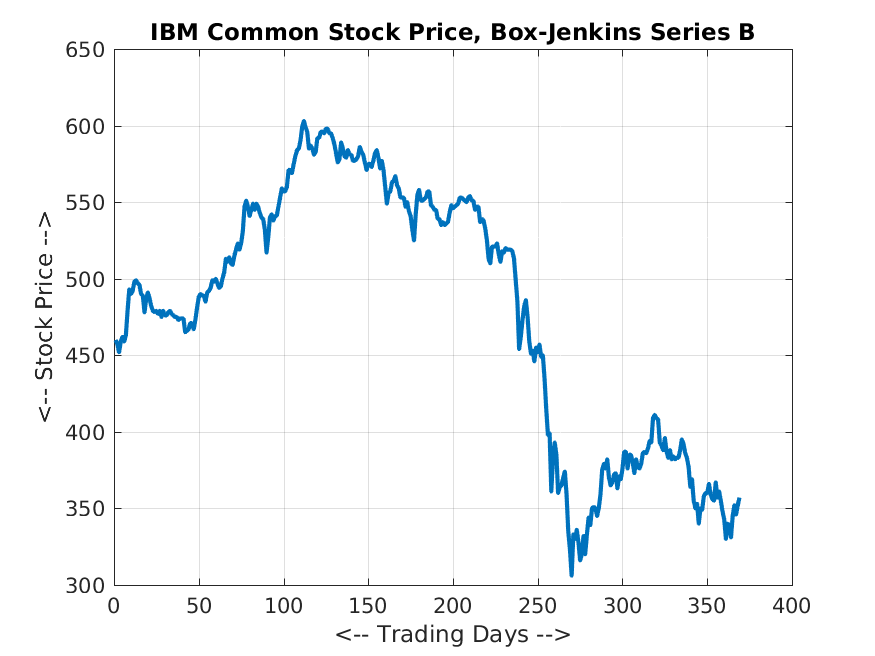
IBM_STOCK is a table of 1 columns and 369 rows, listing the closing price of IBM Common Stock for each trading data from 17 May 1961 to 2 November 1962. This data was presented as series B by Box, Jenkins and Reinsel, 1976.
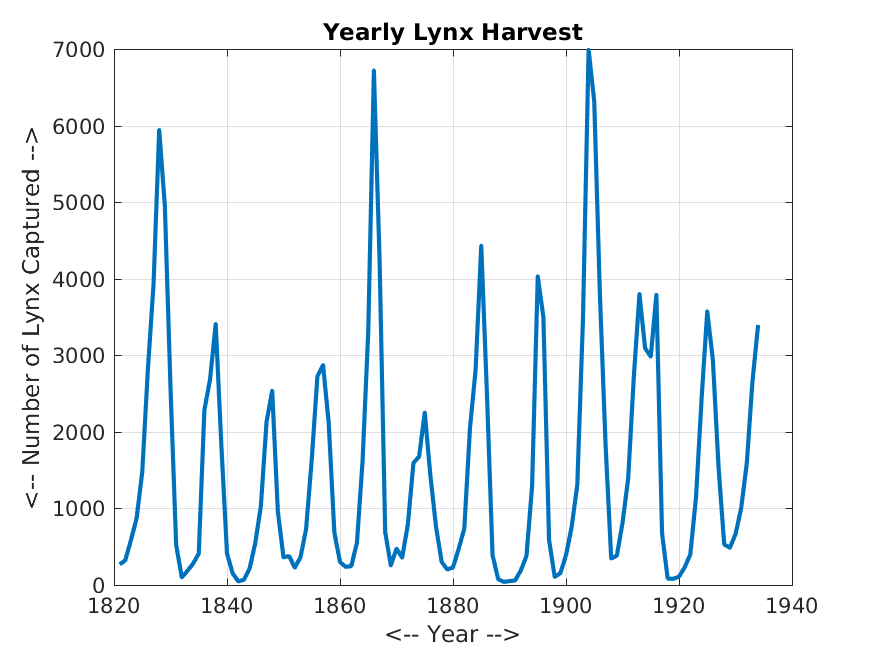
LYNX is a table of two columns. Column 1 is a year index from 1821 to 1934; column 2 is a count of the number of lynx captured that year in the Mackenzie River district of Canada, to be sold by the Hudson's Bay Company.
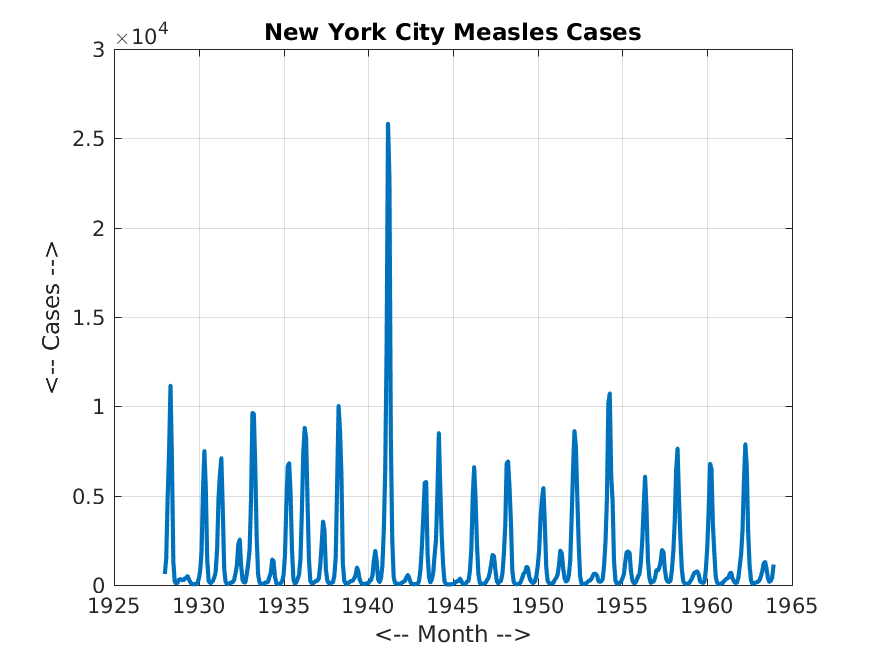
MEASLES_NYC is a table of two columns. Column 1 lists months from January 1, 1928 to November 1, 1963, as decimal values. Column 2 lists the number of measles cases reported over that month.
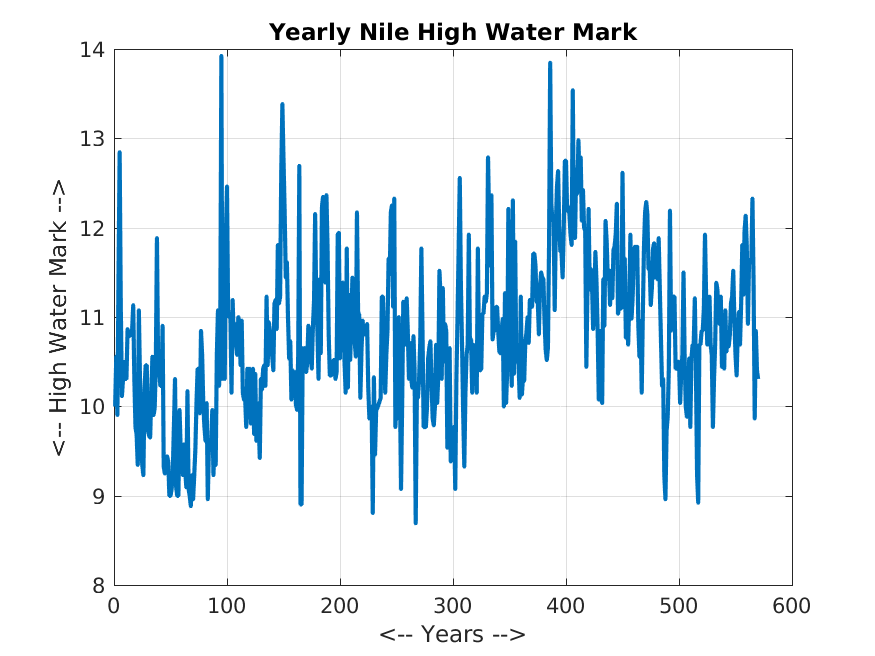
NILE is a table of one column, namely 570 readings for the flow volume of the Nile river.
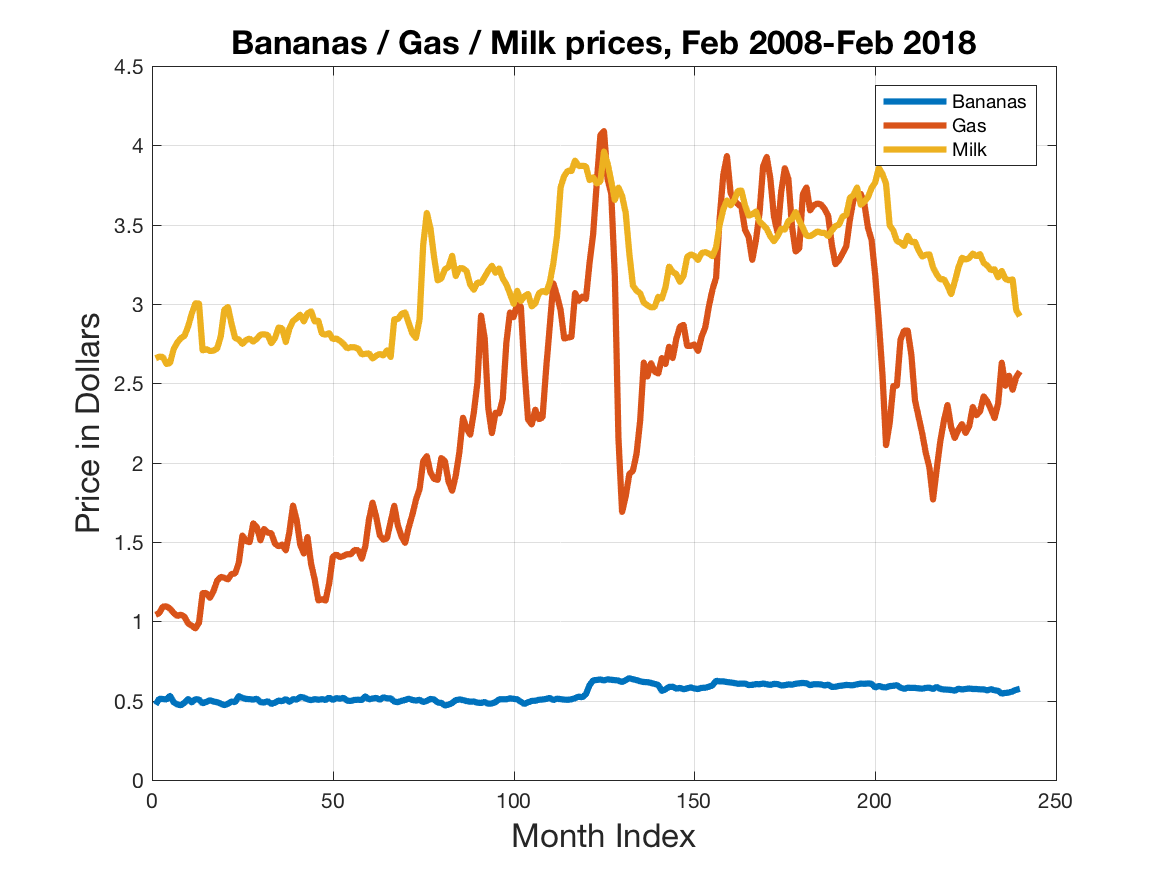
PRICES is a table of average monthly prices for 11 consumer products, between February 2008 and February 2018, as compiled by the Bureau of Labor Statistics.
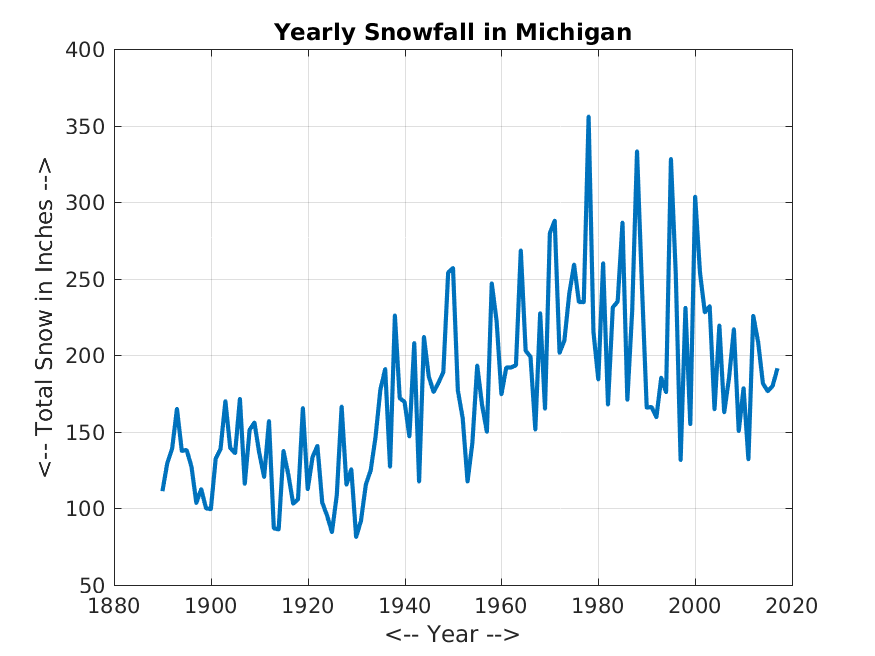
SNOWFALL is a table of 10 columns. Column 1 is the winter year identifier, ranging from 1890-1891 to 2017-2018. Columns 2 through 9 are the snowfall in inches for October, November, December, January, February, March, April and May. Column 10 is the total snowfall. These measurements were taken near Michigan Tech.
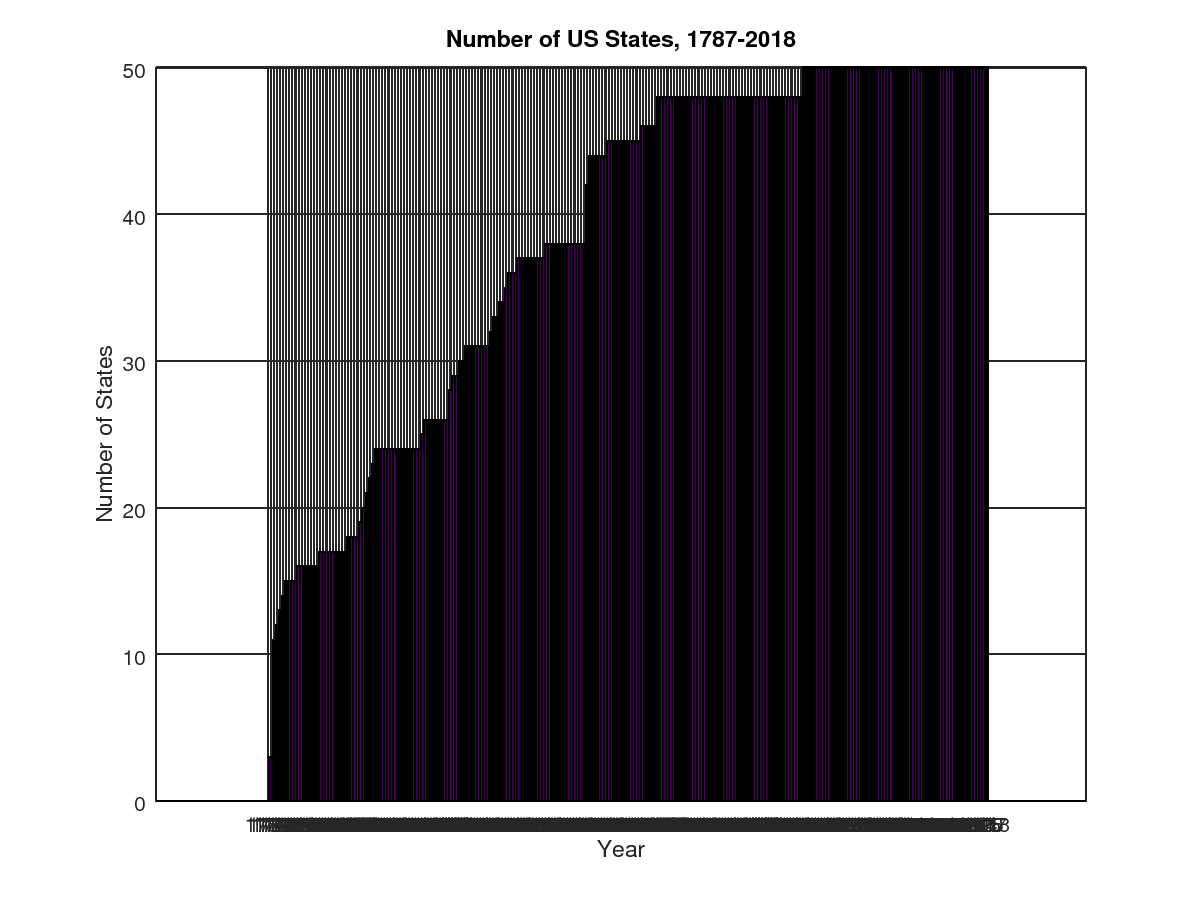
STATE_NUMBER is a table, for each year, of the number of US states.
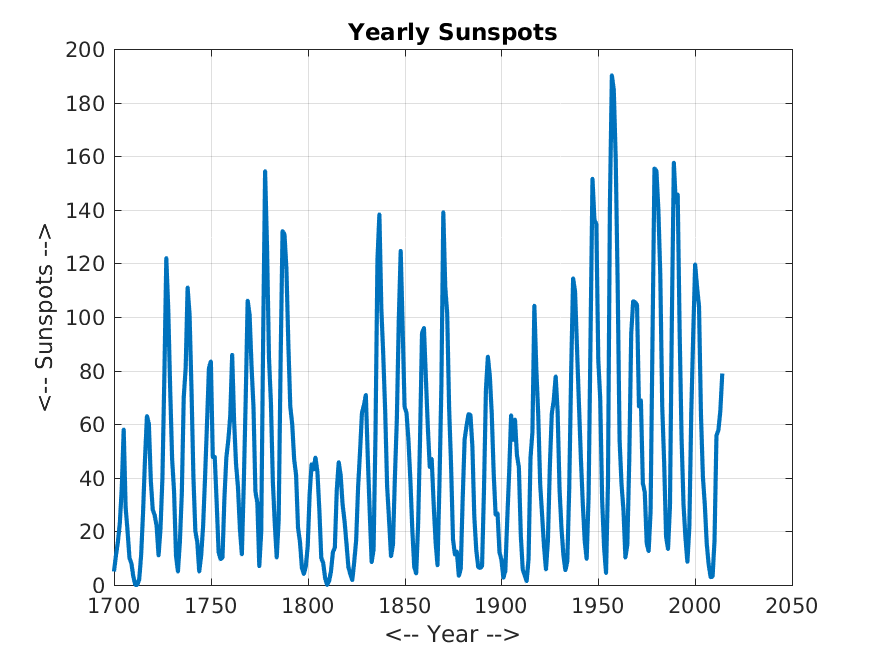
SUNSPOT is a table of two columns. Column 1 is a year index which runs from 1700 to 2014; column 2 is a count of the number of sunspots observed that year.
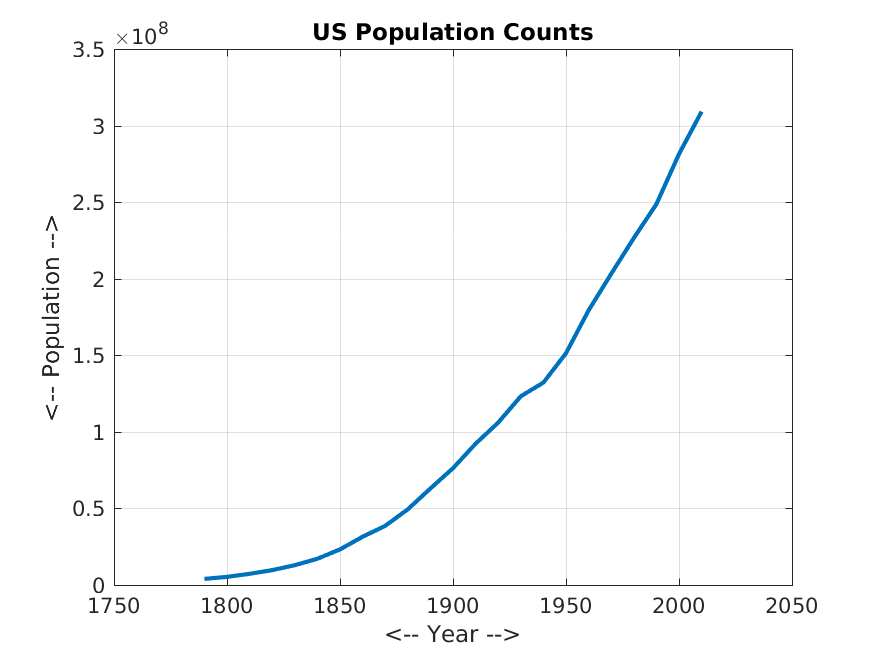
US_POPULATION_CENSUS is a table of two columns. Column 1 is a census year index which runs from 1790 to 2010 by 10's; column 2 is a count of the US population in that year.
US_POPULATION_1900S is a table of two columns. Column 1 is a year index which runs from 1900 to 1999; column 2 is an estimate of the US population in that year.
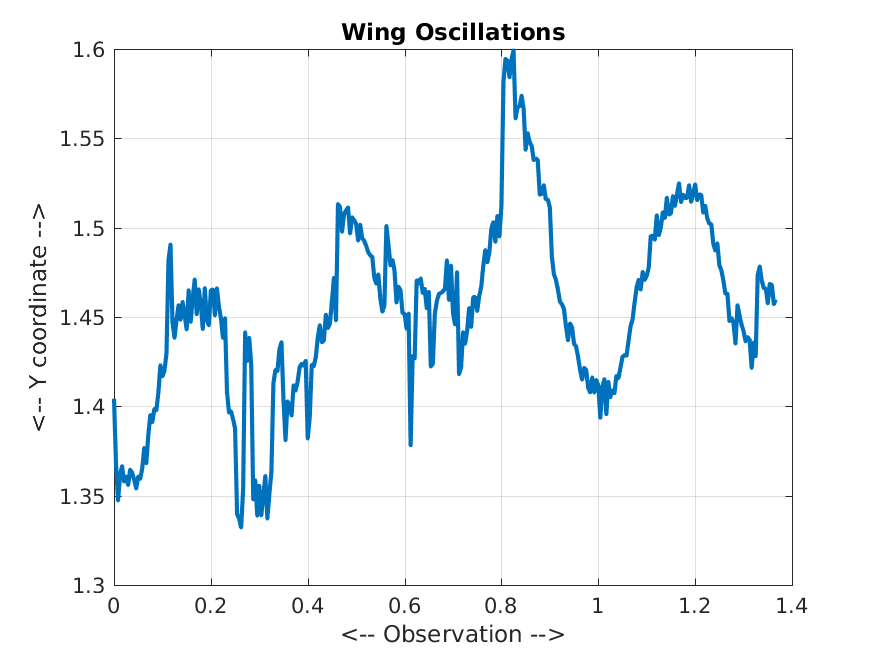
WING_OSCILLATION contains 329 observations of the Y coordinate of the wing tip of a Boeing 737 over time, as reported by Rhett Allain, in Wired Magazine, "The physics of why airplane wings oscillate in turbulence".
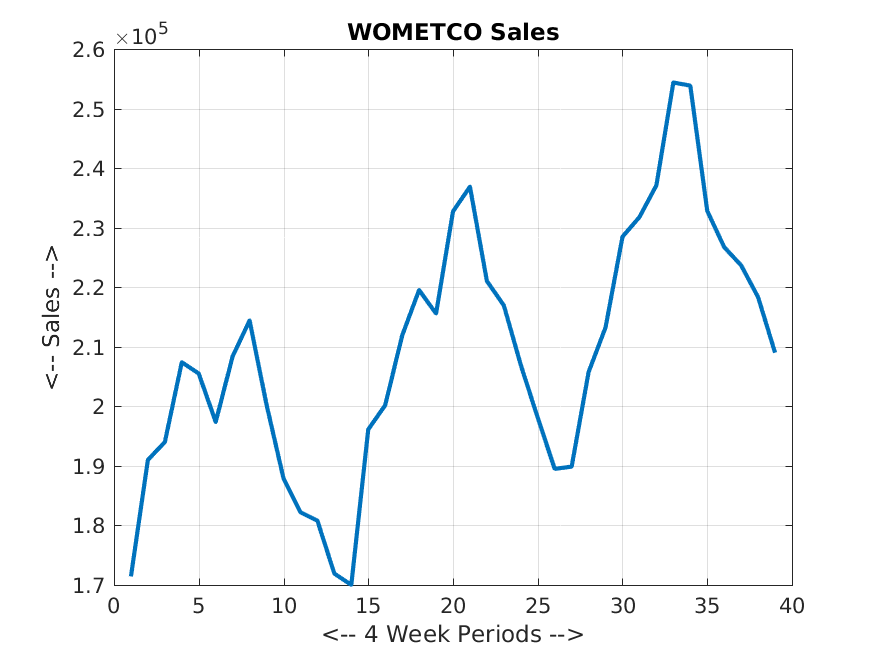
WOMETCO_SALES is a table of two columns, listing 3 years of sales data for a company, computed every four weeks.
You can go up one level to the DATA directory.