GRAPHICS_EXAMPLES, FORTRAN90 programs which illustrate how various kinds of data can be displayed and analyzed graphically.
Some common plot types include:
The computer code and data files described and made available on this web page are distributed under the GNU LGPL license.
GRAPHICS_EXAMPLES programs are available in a C version and a C++ version and a dataset version and a FORTRAN90 version and a MATLAB version and an Octave version and a Python version.
GRAPHICS_EXAMPLES_CONVERT, examples which illustrate how various kinds of data can be processed and modified using the ImageMagick program convert() and its related tools.
GRAPHICS_EXAMPLES_GNUPLOT, examples which illustrate how various kinds of data can be displayed and analyzed graphically using the interactive executable graphics program gnuplot().
GRAPHICS_EXAMPLES_GRACE, examples which illustrate how various kinds of data can be displayed and analyzed graphically using the interactive executable graphics program grace().
GRAPHICS_EXAMPLES_PLOTLY1, examples which illustrate how various kinds of data can be displayed and analyzed graphically, using version 1 of the plotly() program from a browser.
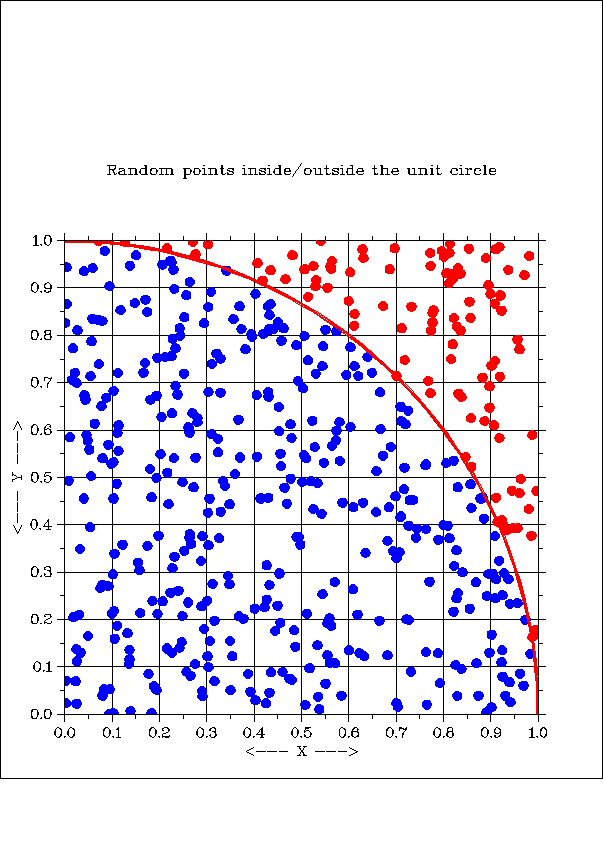
CIRCLE_SCATTERS depicts 500 pairs of (X,Y) data points in the unit square, 395 of which lie inside the unit circle, and 105 outside. If possible, the "inside" points should be blue, the "outside" points red, and the circle itself should also be drawn. The dislin library is used.
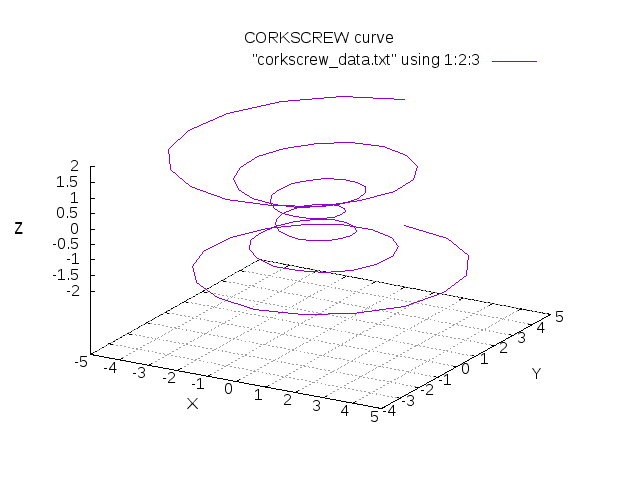
CORKSCREW_PLOT3D generates (X,Y,Z) points that lie along a 3D curve looking something like a corkscrew. The gnuplot() program is used.
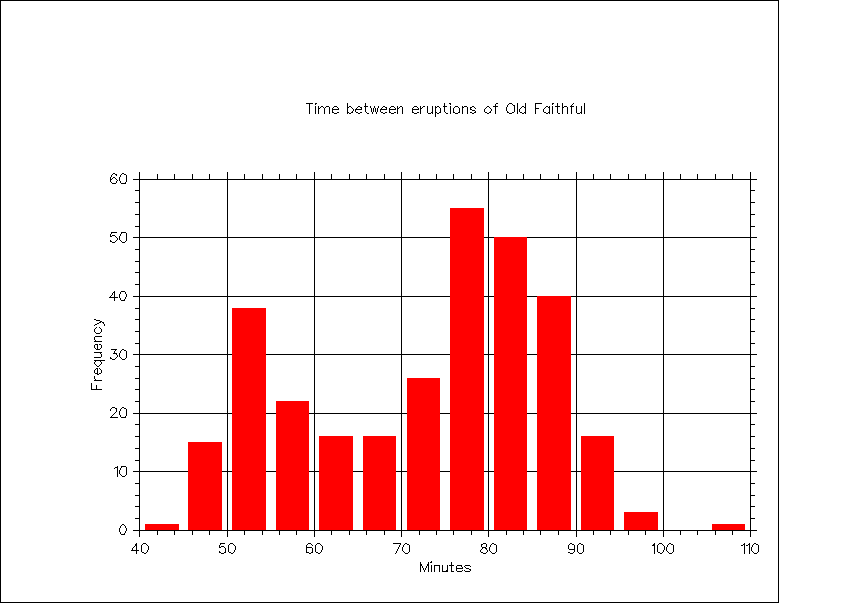
GEYSER_BAR works with measurements of the waiting time in minutes between successive eruptions of the Old Faithful geyser. The data has been grouped into bins. The bin counts are displayed as a bar chart. The dislin library is used.
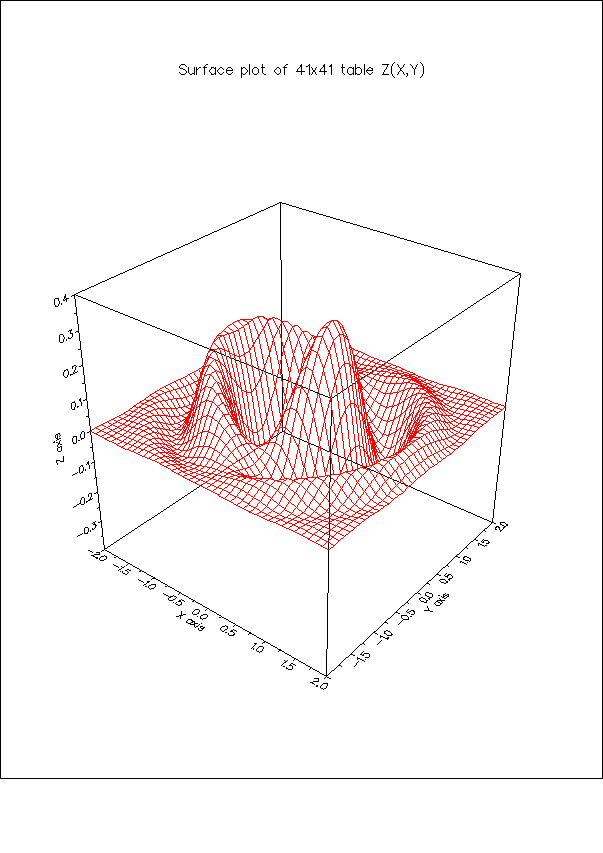
GRID_SURFACE records, on a 41x41 grid over [-2,2]x[-2,+2], the values z = exp(-(x^2+y^2)) * cos(0.25*x) * sin(y) * cos(2*(x^2+y^2)). The data is to be plotted as a surface. The dislin library is used.
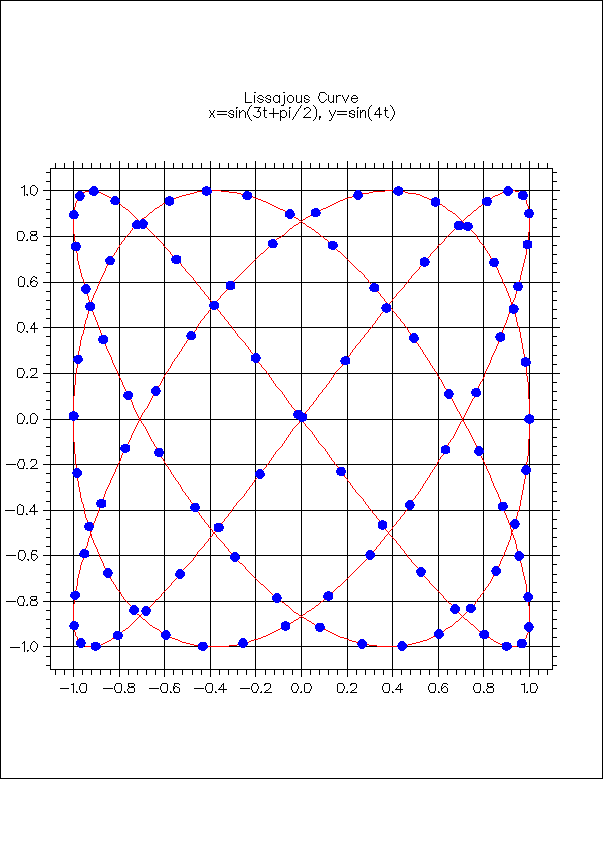
LISSAJOUS_PLOT records 1000 points on a Lissajous curve defined by x=sin(3*t+pi/2), y=sin(4t). The curve is to be plotted and every tenth point marked. The dislin library is used.
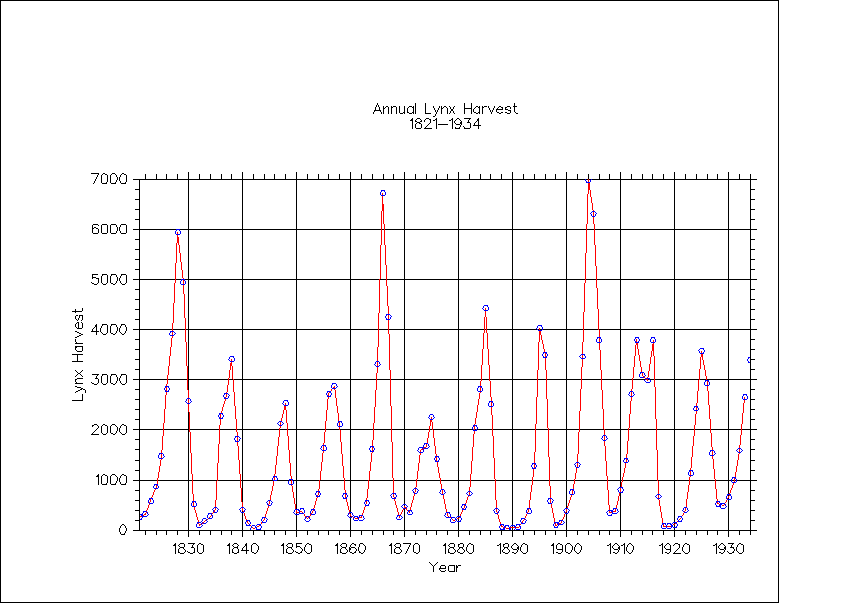
LYNX_PLOT records the yearly lynx harvest from 1821 to 1934. The graph should plot the data points as circles, and connect consecutive data points with straight line segments to suggest a curve. The dislin library is used.
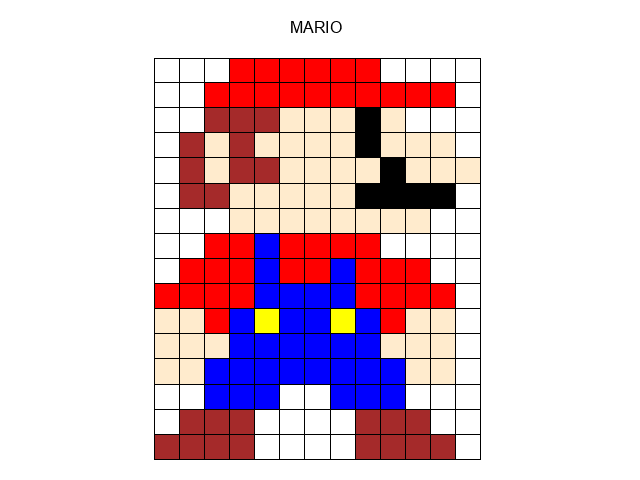
MARIO_FILL makes a simple image of Mario, by constructing a grid of squares filled with color. The gnuplot() program is used.
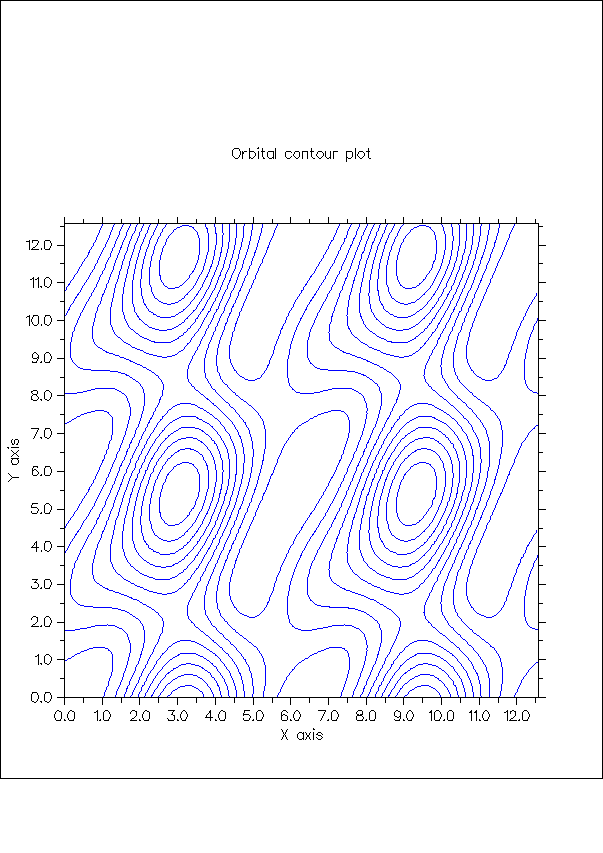
ORBITAL_CONTOUR records, on a 101x101 grid over [0,4*pi]x[0,4*pi], the minimum distance between two planets given a pair of orbital angles. The data is presented as a color contour plot. The dislin library is used.
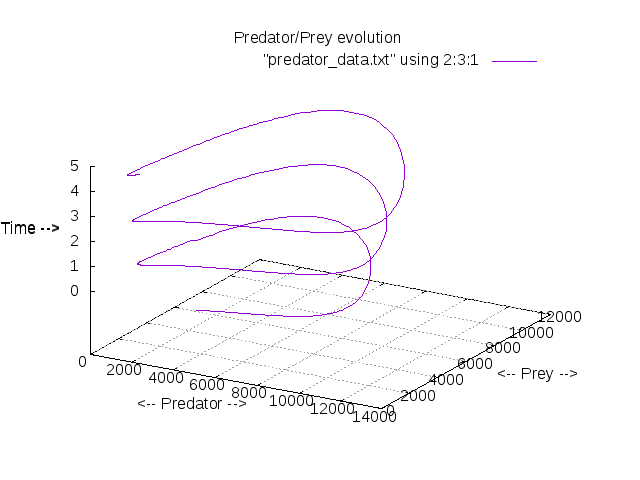
PREDATOR_PLOT3D models the populations of predators (foxes) and prey (rabbits) over time. A 3D plot of (time, rabbits, foxes) is created. The gnuplot() program is used.
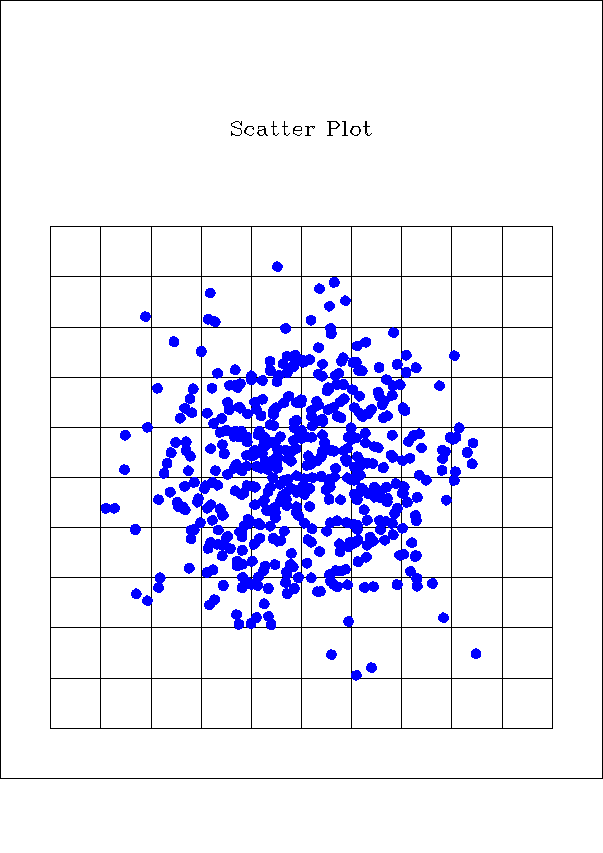
RANDOM_SCATTER generates 500 pairs of (X,Y) data, which lie in the unit square, and tend to cluster around (0.5,0.5). The dislin library is used.
You can go up one level to the FORTRAN90 source codes.