TABLE_TOP is a FORTRAN90 program which displays patterns in a set of N points in M dimensions.
The program simply creates an array of M2 two dimensional subplots. Plot (I,J) plots the I-th and J-th coordinate values against each other. Simple patterns in the data may show up in the plots.
TABLE_TOP then creates a PostScript file containing the plots, using routines from the PS_WRITE library.
The computer code and data files described and made available on this web page are distributed under the GNU LGPL license.
TABLE_TOP is available in a FORTRAN90 version.
PS_WRITE, a FORTRAN90 library which creates a PostScript graphics file. This library is used by TABLE_TOP.
TABLE_BARPLOT_PPMA, a FORTRAN90 program which reads a table file and creates a PPMA bargraph of the data.
TABLE_BORDER, a FORTRAN90 program which can be used to add a border (of zero values) to a table file.
TABLE_COLUMNS, a FORTRAN90 program which can extract specific columns of data from a table file.
TABLE_DELAUNAY, a FORTRAN90 program which computes the Delaunay triangulation of a set of points.
TABLE_HISTOGRAM, a FORTRAN90 program which can make a histogram of a set of points stored in a table file.
TABLE_IO, a FORTRAN90 library which supplies the routines used to read the TABLE file.
TABLE_LATINIZE, a FORTRAN90 program which reads a file of points and creates a "latinized" version by adjusting the data.
TABLE_MERGE, a FORTRAN90 program which reads a file of points and can delete points that are identical or close.
TABLE_ORTHONORMALIZE, a FORTRAN90 program which reads a file of points and orthonormalizes the columns.
TABLE_QUALITY, a FORTRAN90 program which reads a file of points and computes the quality of dispersion.
TABLE_RECORD_MATCH, a FORTRAN90 program which can be used to find close records in a table file.
TABLE_SCALE, a FORTRAN90 program which can be used to multiply the entries of a table file by a scale vector.
TABLE_SHIFT, a FORTRAN90 program which can be used to shift the entries of a table file by a shift vector.
TABLE_STATS, a FORTRAN90 program which can read a table file and compute certain statistics.
TABLE_TET_MESH, a FORTRAN90 program which can read a table file of 3D data, and compute a tetrahedral mesh.
TABLE_UNBORDER, a FORTRAN90 program which can be used to remove the border from a table file.
TABLE_UNIFORM_NOISE, a FORTRAN90 program which can be used to add a uniform noise term to the data in a table file.
TABLE_VORONOI, a FORTRAN90 program which can be used to compute information about the Voronoi diagram of the points.
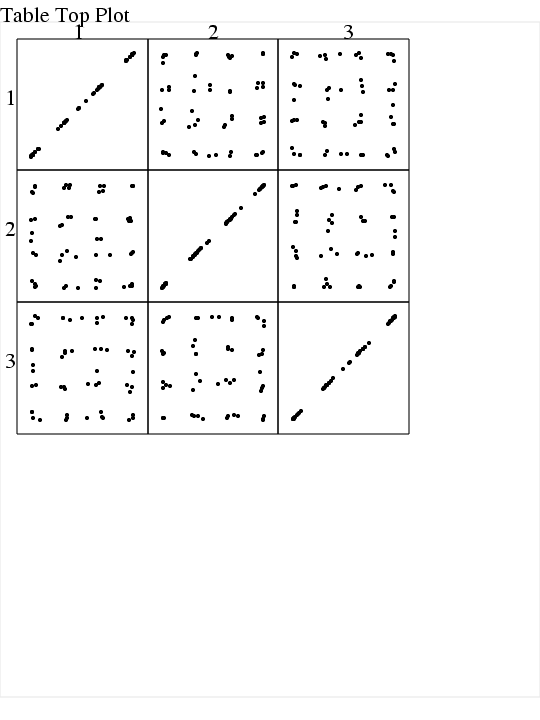
POWERS.TXT is a set of data that does not lie between 0 and 1. (The TABLE_TOP program used to assume, in fact, that the data did lie between 0 and 1.) Test files you may copy include:
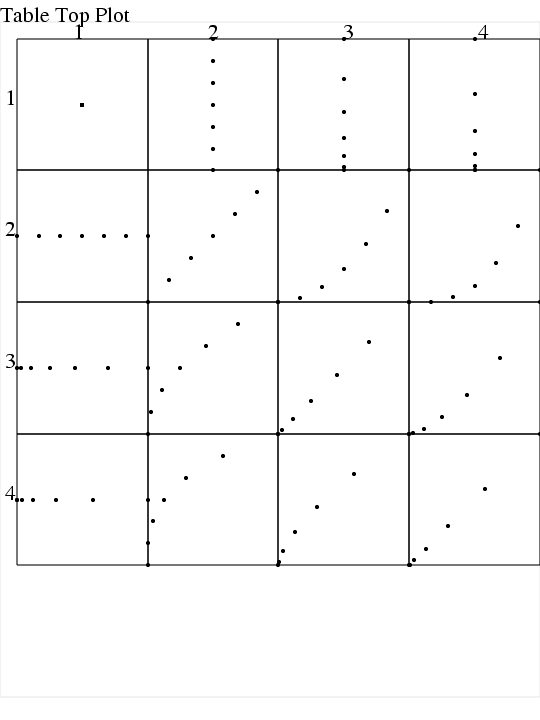
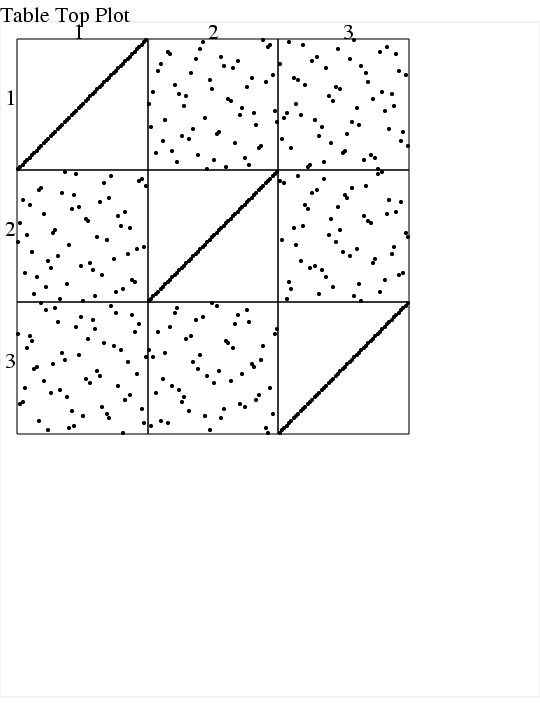
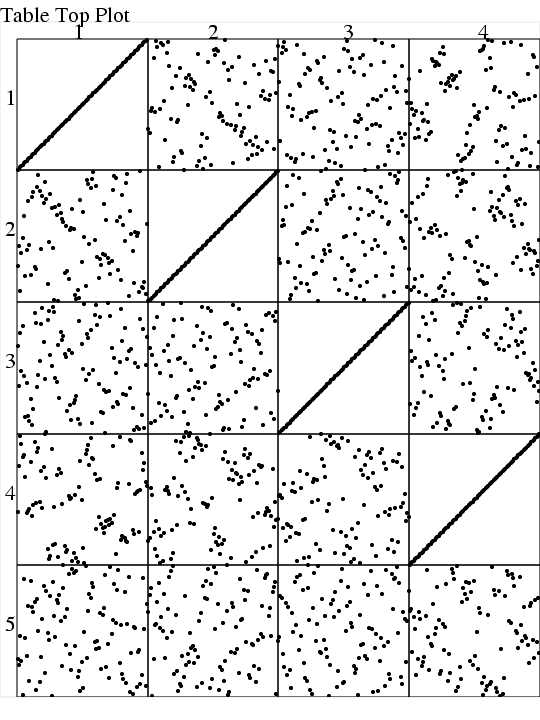
TABLE_TOP_INPUT.TXT is a dummy set of data. There are 10 4 dimensional points. Test files you may copy include:
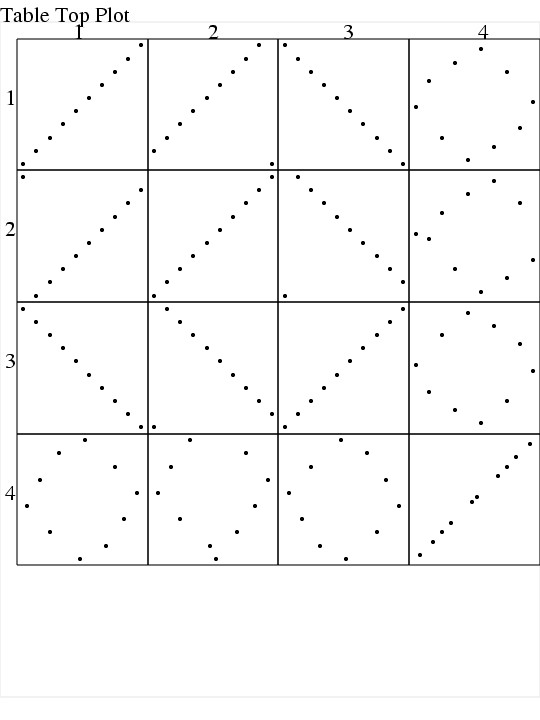
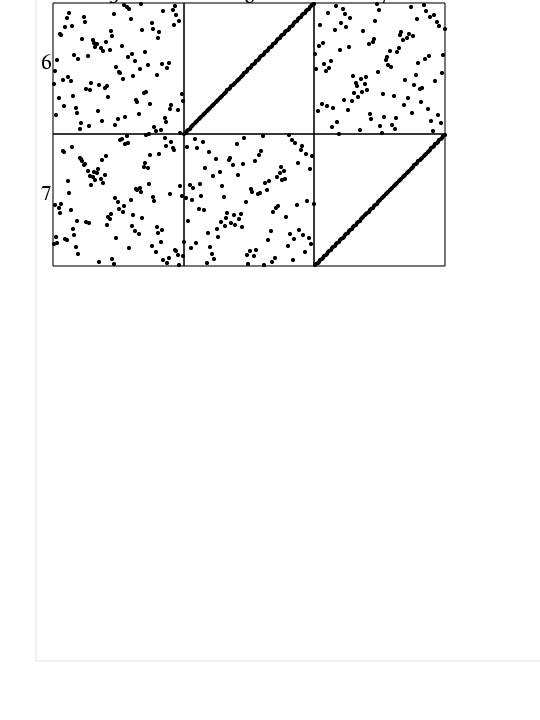
CVT_03_00007.TXT is a set of 3 dimensional data, generated by a centroidal Voronoi tessellation process. We were interested in seeing how the 2D projections looked. Test files you may copy include:
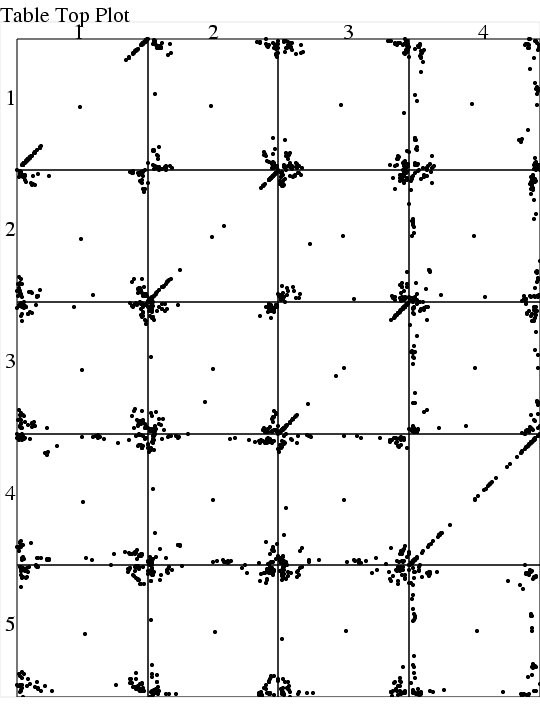
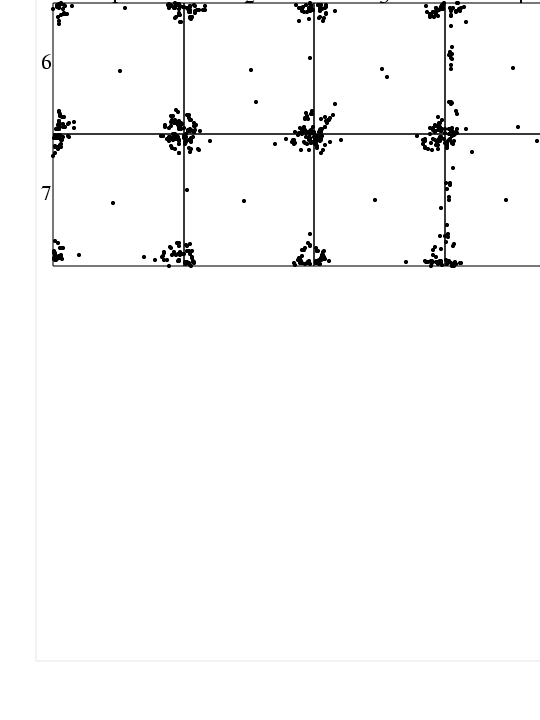
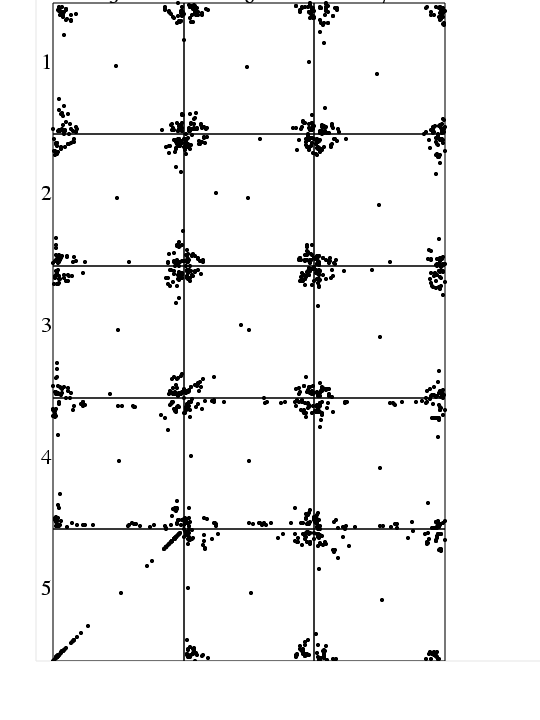
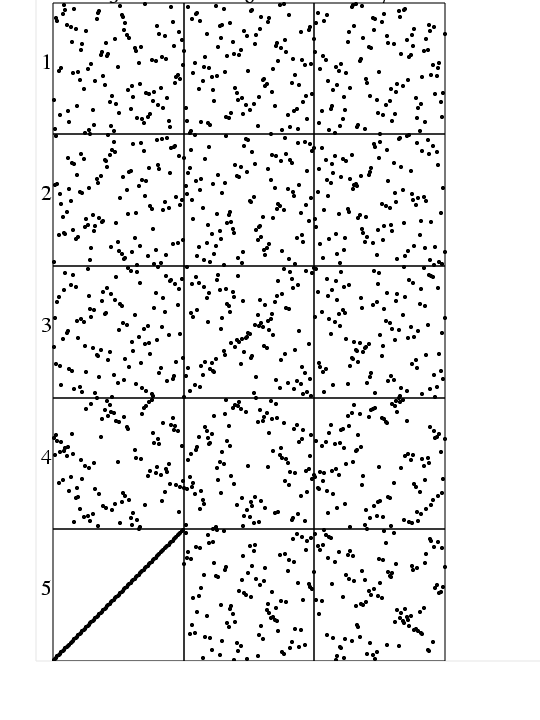
CVT_03_00056.TXT is 8 times as much data as CVT_03_00007.TXT. We really hoped that we would see a pattern, and for once, our hopes were rewarded. The 2D projections clearly indicate the formation of a roughly regular grid that divides the faces into cells. Test files you may copy include:
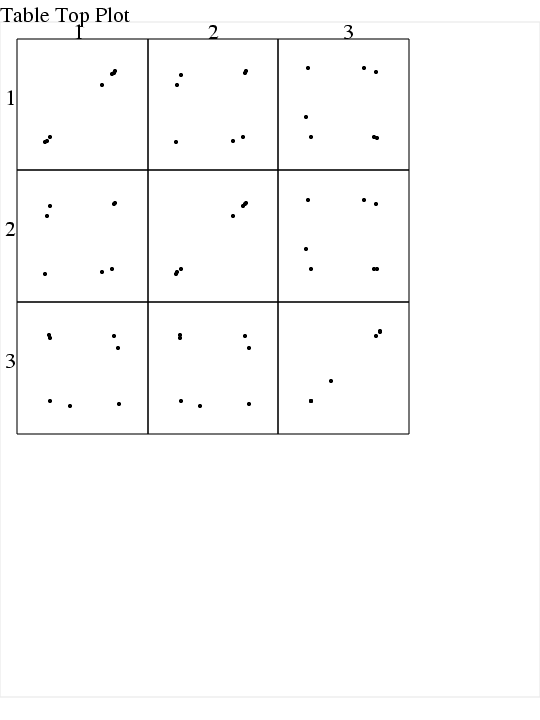
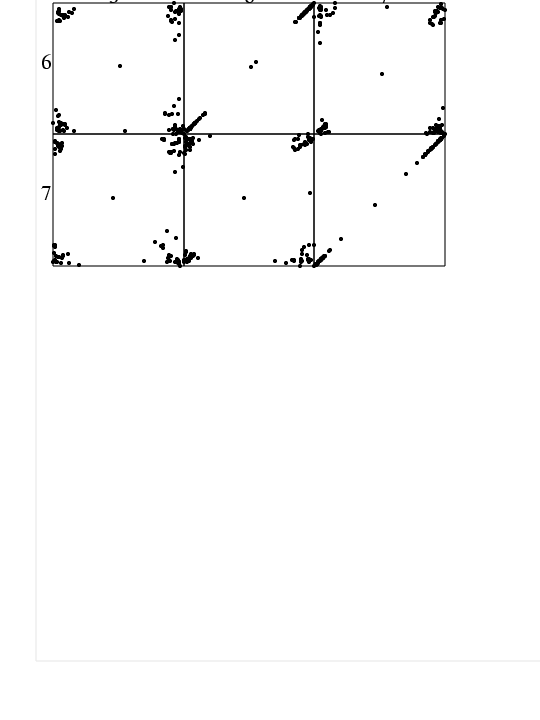
CVT_07_00100.TXT is a set of 7 dimensional data, generated by a centroidal Voronoi tessellation process. It is desirable to have the data points well spread out. However, the facts of 7 dimensional geometry fight against this (let alone any defects in the CVT algorithm)! Test files you may copy include:
You can go up one level to the FORTRAN90 source codes.