gnuplot_test, FORTRAN90 programs which illustrate how commands and data for the GNUPLOT graphics program can be generated, to illustrate the results of a calculation.
Ordinarily, GNUPLOT is used interactively; that is, the user invokes the program, and then describes the plot to be created. The data for the plot is created either by a formula, or by reference to some data file created earlier.
It is often extremely important to be able to create graphical images of the results of an executable program. If the user is familiar with GNUPLOT, then the program can be modified to create a suitable data file, and, once the program has completed, the user can run GNUPLOT and use that data file to create a graph.
However, if the program is going to create the data file, it can just as easily create a file containing the appropriate commands to GNUPLOT that will create the desired image. In this way, the user can avoid having to recall the correct commands in the correct order to create the plot.
Thus, the program might create two files, called, perhaps data.txt and commands.txt. The command file would contain GNUPLOT commands, including one that refers to the data file itself. To create the graphics image, the user would simply type
gnuplot < commands.txt
This directory includes some sample programs which carry out numerical calculations, creating data and command files that are used in exactly this way.
By the way, every time I run gnuplot, I get the obnoxious warning message
Could not find/open font when opening font "arial", using internal non-scalable font
I had to fix this with the following lines added to my .bashrc file:
export GDFONTPATH=/usr/share/fonts/liberation
export GNUPLOT_DEFAULT_GDFONT=LiberationSans-Regular
The computer code and data files made available on this web page are distributed under the GNU LGPL license.
gnuplot_test is available in a C version and a C++ version and a FORTRAN90 version and a MATLAB version.
ANALEMMA, a FORTRAN90 program which evaluates the equation of time, a formula for the difference between the uniform 24 hour day and the actual position of the sun, creating data that can be plotted by gnuplot, based on a program by Brian Tung.
BLACK_SCHOLES, a FORTRAN90 library which implements some simple approaches to the Black-Scholes option valuation theory, creating graphics files for processing by gnuplot, by Desmond Higham.
BROWNIAN_MOTION_SIMULATION, a FORTRAN90 library which simulates Brownian motion in an M-dimensional region, creating graphics files that can be displayed with gnuplot.
CIRCLE_SEGMENT, a FORTRAN90 library which carries out computations associated with a circle segment, including height, angle, area, centroid, sampling, and quadrature, creating some graphics plots using gnuplot.
DISK_GRID, a FORTRAN90 library which computes grid points that lie inside a disk of user specified radius and center in 2D, using gnuplot to create an image of the grid.
DISLIN, FORTRAN90 programs which illustrate the use of DISLIN, a scientific graphics package, by Helmut Michels.
EDGE, a FORTRAN90 library which defines some test functions in 1D, 2D and 3D for the detection of edges or discontinuities. It uses gnuplot to display the jumps in curves and surfaces.
FAIR_DICE_SIMULATION, a FORTRAN90 program which simulates N games in which two fair dice are thrown and summed, creating graphics files for processing by gnuplot.
FD1D_ADVECTION_FTCS, a FORTRAN90 program which applies the finite difference method (FDM) to solve the time-dependent advection equation ut = - c * ux in one spatial dimension, with a constant velocity, using the forward time, centered space (FTCS) difference method, writing graphics files for processing by gnuplot.
FD1D_ADVECTION_LAX, a FORTRAN90 program which applies the finite difference method (FDM) to solve the time-dependent advection equation ut = - c * ux in one spatial dimension, with a constant velocity, using the Lax method to treat the time derivative, writing graphics files for processing by gnuplot.
FD1D_ADVECTION_LAX_WENDROFF, a FORTRAN90 program which applies the finite difference method (FDM) to solve the time-dependent advection equation ut = - c * ux in one spatial dimension, with a constant velocity, using the Lax-Wendroff method to treat the time derivative, writing graphics files for processing by gnuplot.
FD1D_PREDATOR_PREY, a FORTRAN90 program which implements the finite difference method (FDM) for a predator-prey system with spatial variation in 1D, creating graphics files for processing by gnuplot, by Marcus Garvie.
GNUFOR, a FORTRAN90 library which provides an interface to the gnuplot graphics library.
HIGH_CARD_SIMULATION, a FORTRAN90 program which simulates a situation in which you see the cards in a deck one by one, and must select the one you think is the highest and stop; the program uses gnuplot for graphics.
ISING_2D_SIMULATION, a FORTRAN90 program which carries out a Monte Carlo simulation of an Ising model. a 2D array of positive and negative charges, each of which is likely to flip to be in agreement with neighbors, using gnuplot to make images of the initial and final configurations.
LEBESGUE, a FORTRAN90 library which is given a set of nodes in 1D, and plots the Lebesgue function, and estimates the Lebesgue constant, which measures the maximum magnitude of the potential error of Lagrange polynomial interpolation, and which uses gnuplot to make plots of the Lebesgue function.
LOBATTO_POLYNOMIAL, a FORTRAN90 library which evaluates Lobatto polynomials, similar to Legendre polynomials except that they are zero at both endpoints.
LORENZ_ODE, a FORTRAN90 program which approximates solutions to the Lorenz system, creating output files that can be displayed by gnuplot.
MD1, a FORTRAN90 program which carries out a molecular dynamics simulation, and which writes graphics files for processing by gnuplot.
NACA, a FORTRAN90 library which can take the parameters of certain NACA airfoils and return the coordinates of a sequence of points that outline the wing shape. The data can be displayed with gnuplot.
NEAREST_INTERP_1D, a FORTRAN90 library which interpolates a set of data using a piecewise constant interpolant defined by the nearest neighbor criterion, creating graphics files for processing by gnuplot.
ORNSTEIN_UHLENBECK, a FORTRAN90 library which approximates solutions of the Ornstein-Uhlenbeck stochastic ordinary differential equation (SODE) using the Euler method and the Euler-Maruyama method, and creating graphics files for processing by gnuplot.
PADUA, a FORTRAN90 library which returns the points and weights for Padu sets, useful for interpolation in 2D. The points are plotted with gnuplot.
POISSON_SIMULATION, a FORTRAN90 library which simulates a Poisson process in which events randomly occur with an average waiting time of Lambda, creating output for graphics by gnuplot.
POLYGON_TRIANGULATE, a FORTRAN90 library which triangulates a possibly nonconvex polygon, and which can use gnuplot to display the external edges and internal diagonals of the triangulation.
PWL_INTERP_1D, a FORTRAN90 library which interpolates a set of data using a piecewise linear function, creating graphics files for processing by gnuplot.
SDE, a FORTRAN90 library which illustrates properties of stochastic ordinary differential equations (SODE's), and common algorithms for their analysis, including the Euler method, the Euler-Maruyama method, and the Milstein method, making graphics files for processing and display by gnuplot, by Desmond Higham;
SPIRAL_DATA, a FORTRAN90 program which computes a velocity vector field that satisfies the continuity equation, writing the data to a file that can be plotted by gnuplot.
SPRING_ODE2, a FORTRAN90 program which shows how gnuplot graphics can be used to illustrate a solution of the ordinary differential equation (ODE) that describes the motion of a weight attached to a spring.
STOCHASTIC_DIFFUSION, a FORTRAN90 library which implements several versions of a stochastic diffusivity coefficient, and displays sample results using gnuplot.
STOCHASTIC_HEAT2D, a FORTRAN90 program which implements a finite difference method (FDM) for the steady (time independent) 2D heat equation, with a stochastic heat diffusivity coefficient.
STRING_SIMULATION, a FORTRAN90 program which simulates the behavior of a vibrating string, creating files that can be displayed by gnuplot.
SVD_SNOWFALL, a FORTRAN90 program which reads a file containing historical snowfall data and analyzes the data with the Singular Value Decomposition (SVD), and plots created by gnuplot.
TWO_BODY_SIMULATION, a FORTRAN90 program which simulates the behavior of two bodies, constrained to lie in a plane, moving under the influence of gravity, with one body much more massive than the other, creating graphics files for processing by gnuplot.
VANDERMONDE_INTERP_1D, a FORTRAN90 library which finds a polynomial interpolant to data y(x) of a 1D argument, by setting up and solving a linear system for the polynomial coefficients, involving the Vandermonde matrix, creating graphics files for processing by gnuplot.
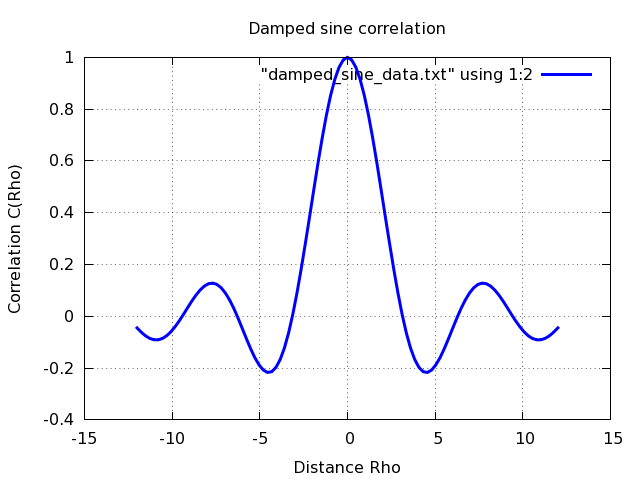
DAMPED_SINE evaluates the damped sine correlation function for a range of values of its argument. A plot of the function is desired.
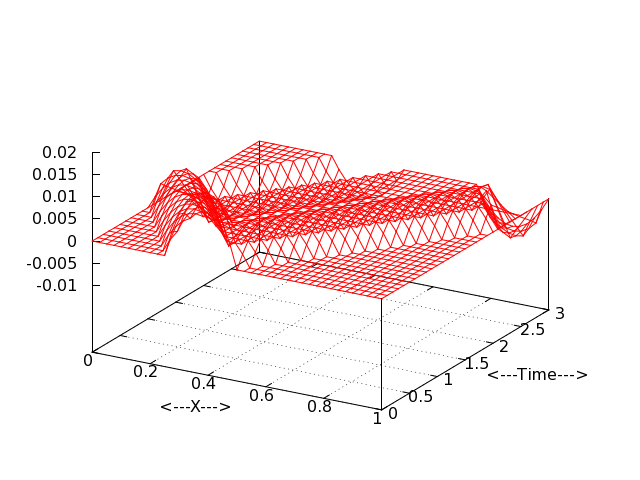
STRING_SIMULATION simulates the behavior of a string that obeys the wave equation. The shape of the string is to be plotted over successive times.
You can go up one level to the FORTRAN90 directory.