gnuplot_test, MATLAB programs which illustrate how commands and data for the GNUPLOT graphics program can be generated, to illustrate the results of a calculation.
Ordinarily, GNUPLOT is used interactively; that is, the user invokes the program, and then describes the plot to be created. The data for the plot is created either by a formula, or by reference to some data file created earlier.
It is often extremely important to be able to create graphical images of the results of an executable program. If the user is familiar with GNUPLOT, then the program can be modified to create a suitable data file, and, once the program has completed, the user can run GNUPLOT and use that data file to create a graph.
However, if the program is going to create the data file, it can just as easily create a file containing the appropriate commands to GNUPLOT that will create the desired image. In this way, the user can avoid having to recall the correct commands in the correct order to create the plot.
Thus, the program might create two files, called, perhaps data.txt and commands.txt. The command file would contain GNUPLOT commands, including one that refers to the data file itself. To create the graphics image, the user would simply type
gnuplot < commands.txt
This directory includes some sample programs which carry out numerical calculations, creating data and command files that are used in exactly this way.
By the way, every time I run gnuplot, I get the obnoxious warning message
Could not find/open font when opening font "arial", using internal non-scalable font
I had to fix this with the following lines added to my .bashrc file:
export GDFONTPATH=/usr/share/fonts/liberation
export GNUPLOT_DEFAULT_GDFONT=LiberationSans-Regular
The computer code described and made available on this web page are distributed under the GNU LGPL license.
gnuplot_test is available in a C version and a C++ version and a FORTRAN90 version and a MATLAB version.
FEM2D_PLOT_GPL, a MATLAB program which reads information about nodes, elements and nodal values for a 2D finite element method (FEM) and creates a GPL file describing a surface plot of U(X,Y), which can be displayed by GNUPLOT.
GPL_DISPLAY, a MATLAB library which tries to read the data in a typical gnuplot GPL file, and display it in a more attractive way than gnuplot is capable of.
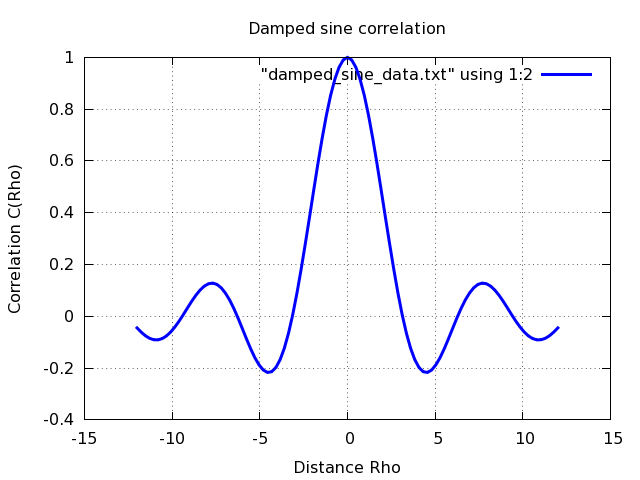
DAMPED_SINE evaluates the damped sine correlation function for a range of values of its argument. A plot of the function is desired.
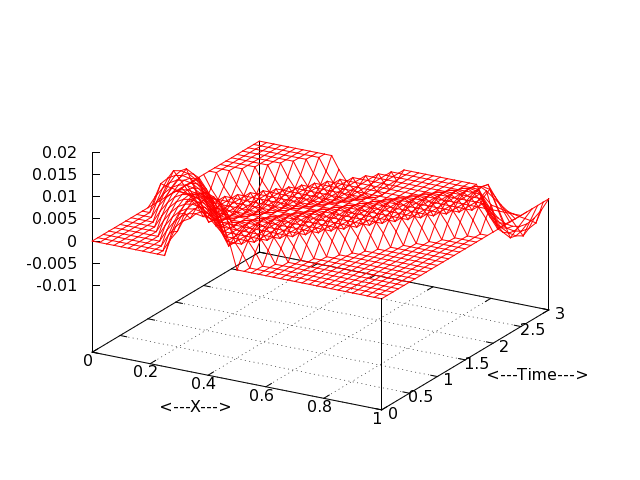
STRING_SIMULATION simulates the behavior of a string that obeys the wave equation. The shape of the string is to be plotted over successive times.
You can go up one level to the MATLAB directory.