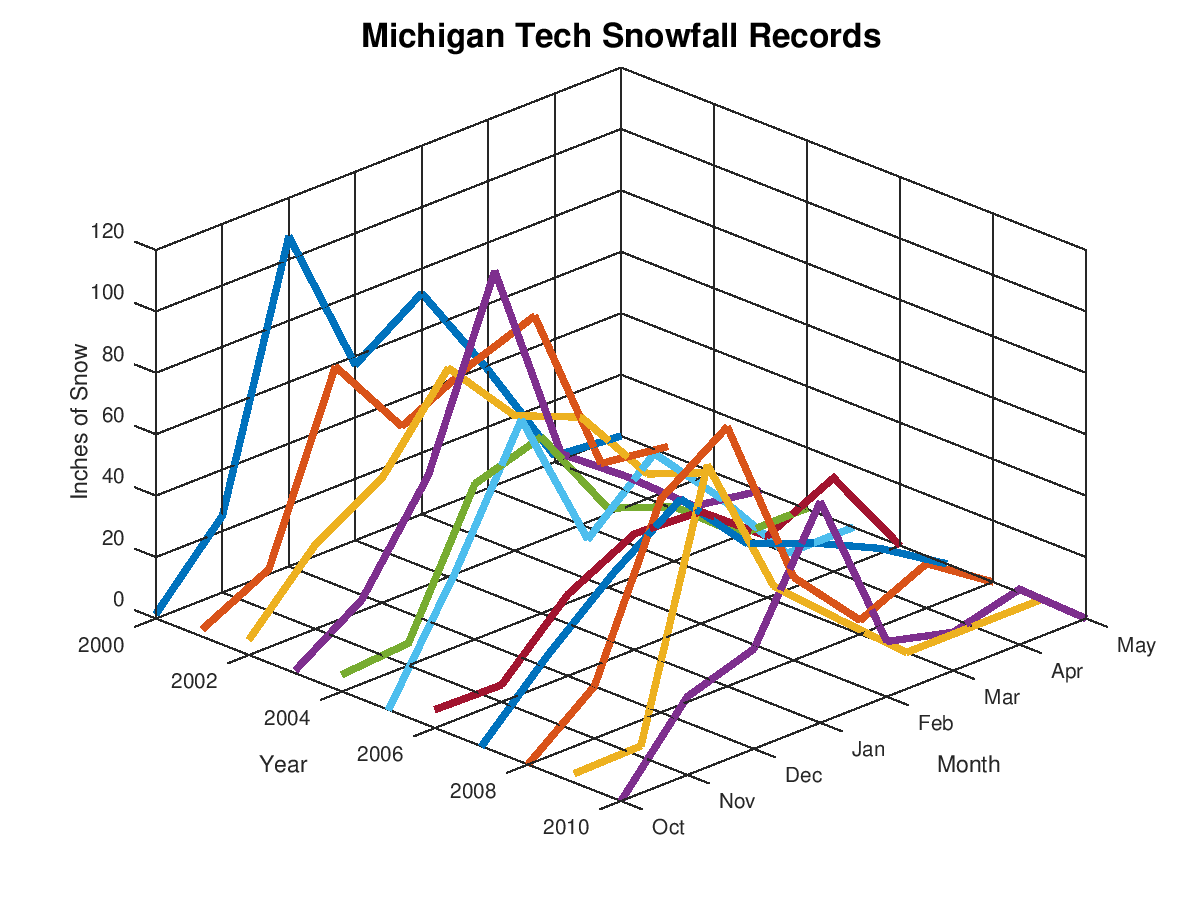
side_by_side_display_test a MATLAB program which display curves side by side in a 3D plot; the curves might be yearly snowfall data over consecutive years, for instance.
The computer code and data files described and made available on this web page are distributed under the GNU LGPL license.
side_by_side_display_test is available in a MATLAB version.
GRAPHICS_EXAMPLES, MATLAB programs which illustrate how various kinds of data can be displayed and analyzed graphically.
HISTOGRAM_DISPLAY, a MATLAB program which makes a bar plot of a set of data stored as columns in a file; the first column is the X values, and all the other columns are Y values to be shown as a stack of bars;
SVD_SNOWFALL, a MATLAB library which reads a file containing historical snowfall data and analyzes the data with the Singular Value Decomposition (SVD).
TIME_SERIES, a dataset directory which contains examples of files describing time series.
The SNOWFALL example works with a database of snowfall data from Michigan Tech. The idea is to extract the records for the years 2000 through 2010, and show them together.