GNUPLOT is an interactive plotting program.
Copies of the source code for GNUPLOT, or an executable for Windows machines, can be obtained from the official website.
GNUPLOT can do a variety of graphics functions, including plots of
By the way, every time I run gnuplot, I get the obnoxious warning message
Could not find/open font when opening font "arial", using internal non-scalable font
I had to fix this with the following lines added to my .bashrc file:
export GDFONTPATH=/usr/share/fonts/liberation
export GNUPLOT_DEFAULT_GDFONT=LiberationSans-Regular
The computer code and data files described and made available on this web page are distributed under the GNU LGPL license.
GNUPLOT is available in a non-language specific version and a C version and a C++ version and a FORTRAN77 version and a FORTRAN90 version and a MATLAB version.
GNUFOR, a FORTRAN90 library which provides an interface to the GNUPLOT graphics library.
GNUPLOT_I, a C library which allows an executing C, C++, FORTRAN77 or FORTRAN90 program to interact with the GNUPLOT graphics program.
GNUPLOT_I_EXAMPLES, C programs which demonstrate the use of the GNUPLOT_I library for interactive runtime GNUPLOT graphics.
GNUPLOT_I_EXAMPLES, C++ programs which demonstrate the use of the GNUPLOT_I library for interactive runtime GNUPLOT graphics.
MD1, a FORTRAN90 program which carries out a molecular dynamics simulation whose output is immediately suitable for input to GNUPLOT.
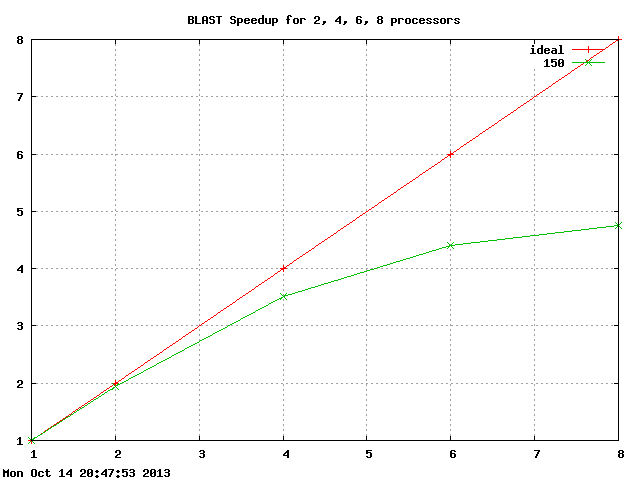
BLAST1 illustrates the speedup of the BLAST program on 2, 4, 6 or 8 processors, for sequences of length 150.
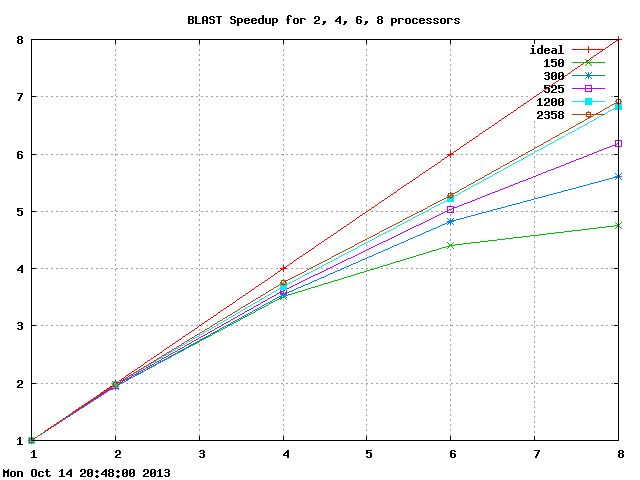
BLAST5 illustrates the speedup of the BLAST program on 2, 4, 6 or 8 processors, for sequences of length 150, 300, 525, 1200 or 2358.
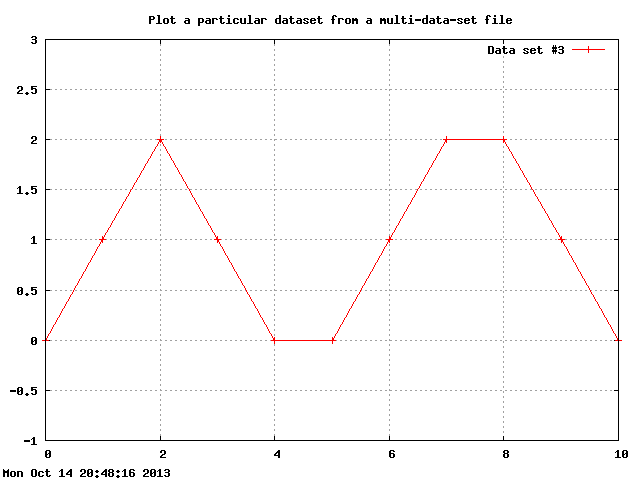
BLOCKS plots some of the blocks of data in a file:
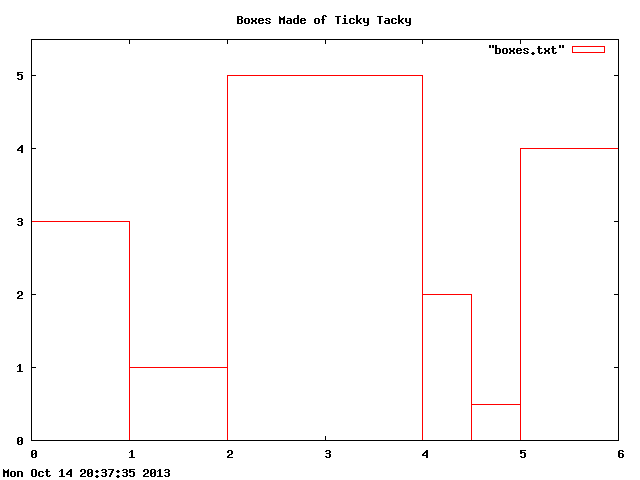
BOXES is an application that plots bar charts. (Sorry, GNUPLOT can't do filled in color bar charts yet!)
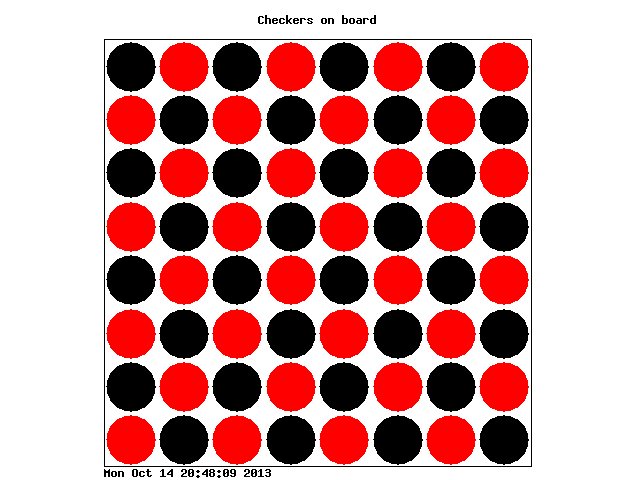
CHECKERS draws red and black circles occupying the 8 x 8 grid of a checkerboard.
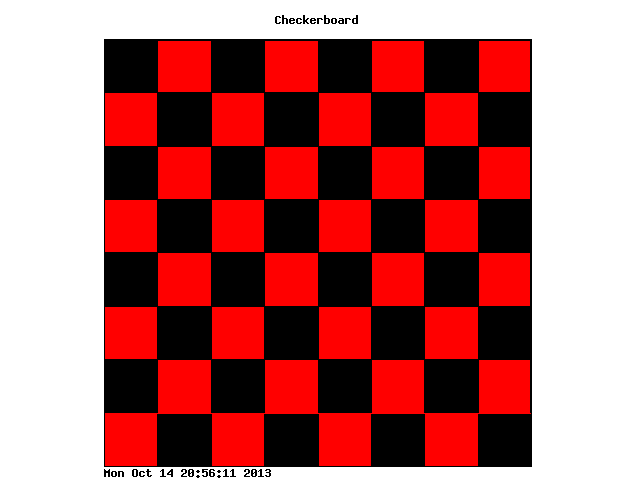
CHECKERBOARD draws a checkerboard of 64 red and black squares. It does this by specifying the location and color of each square. Note that, as far as I can tell, we have to include a bogus "plot" command that plots something in order for the 64 squares to show up. Drawing filled graphics like this is not something GNUPLOT is known for.
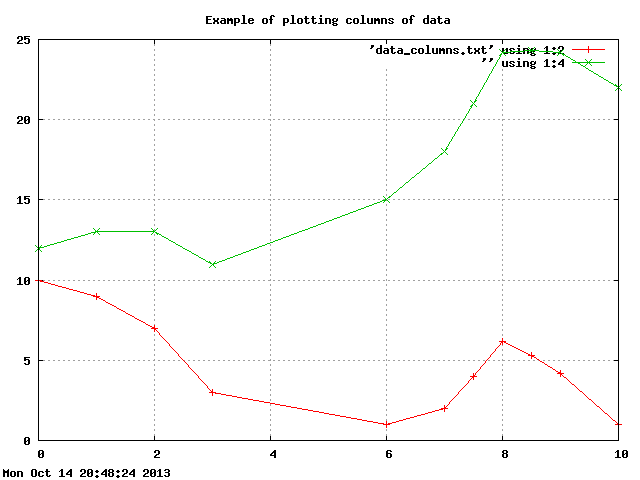
COLUMNS plots some of the columns of data in a file:
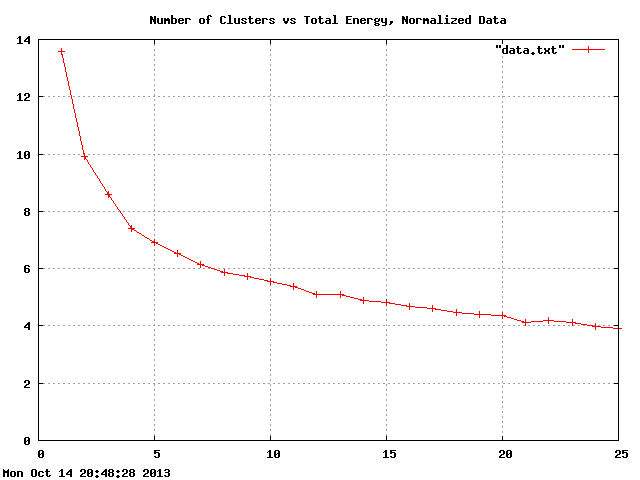
CLUSTER is a sample application that plots data in a file.
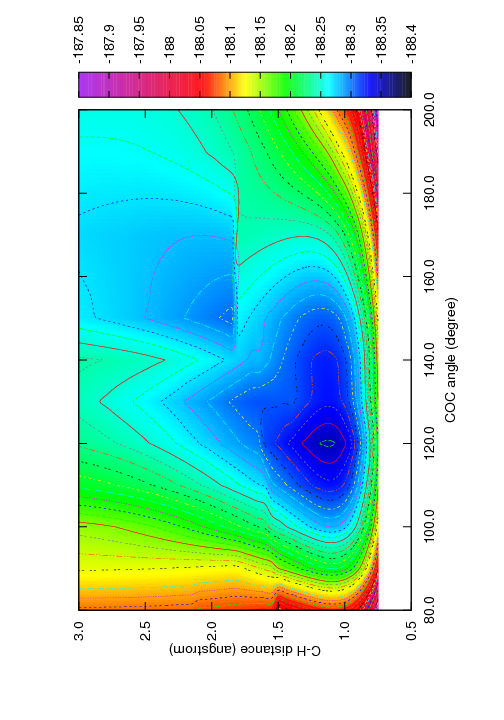
FILLED_CONTOURS makes a contour plot with color between the contour lines.
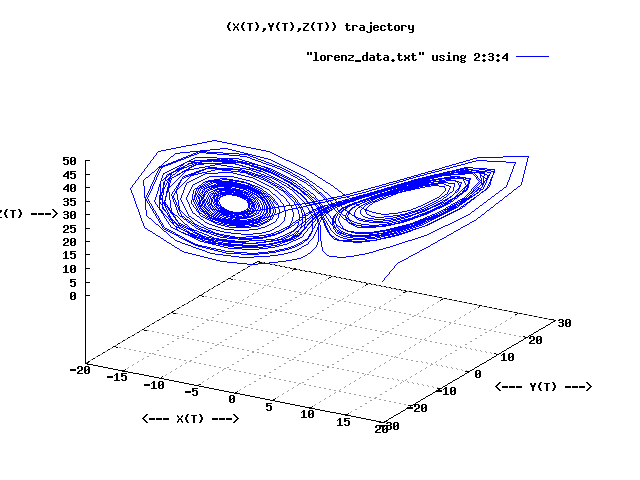
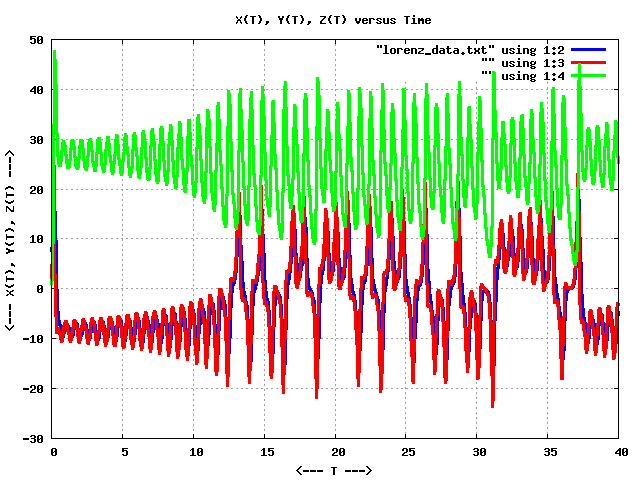
LORENZ plots sample points from a solution of the Lorenz equations.
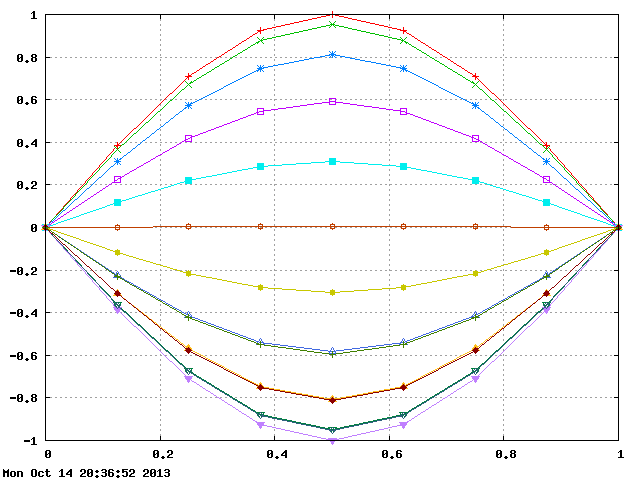
MANY_CURVES contains many columns of data. We want to plot column 1 as X, and each of columns 2 through 15 as Y, without typing 14 separate commands. The solution is to use a FOR loop!
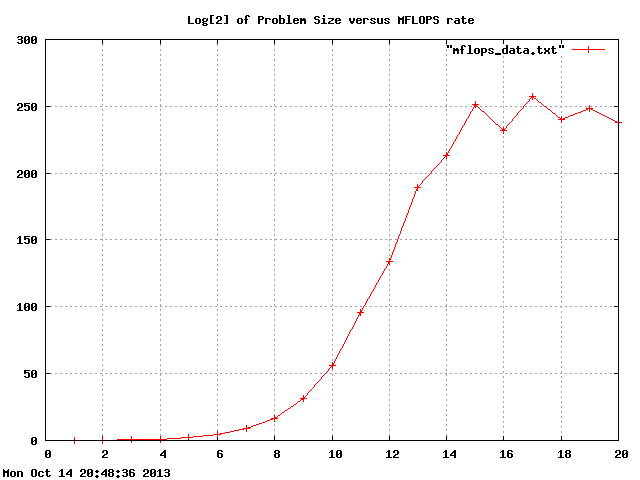
MFLOPS records the logarithm base 2 of the vector size, versus the MegaFLOPS rate, for an FFT calculation run using OpenMP on 2 processors. The data shows how the MegaFLOPS rate rises steeply, levels off, and begins, perhaps, to fall.
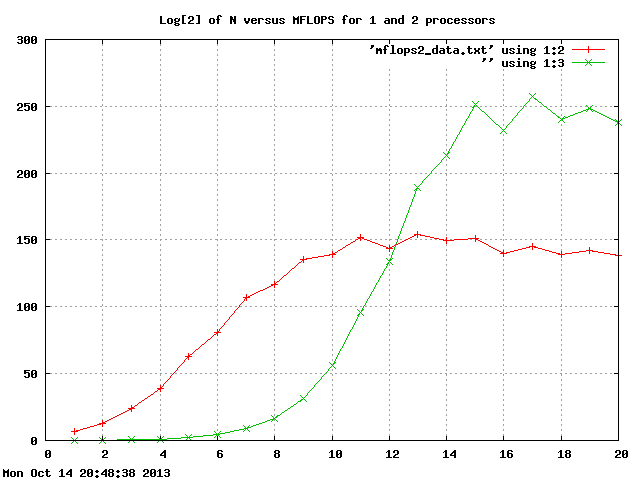
MFLOPS2 records the logarithm base 2 of the vector size, versus the MegaFLOPS rate, for an FFT calculation run using OpenMP on 1 and 2 processors. The data shows how the MegaFLOPS rate for the 1 processor program rises more quickly, but levels off sooner.
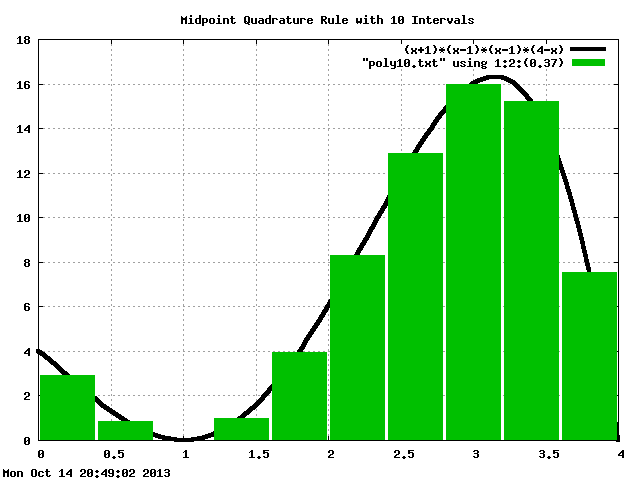
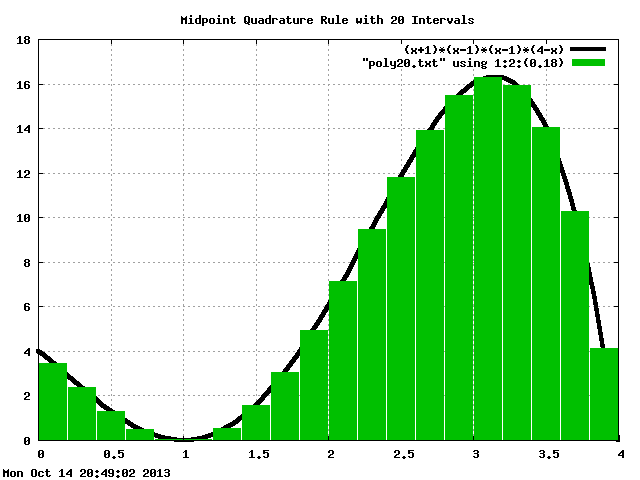
MIDPOINT is an illustration of the midpoint quadrature rule. Given a function, we show how the area under the curve can be approximated using 10, 20 and 40 rectanges whose height is determined by the function value at the midpoint of equally spaced subintervals
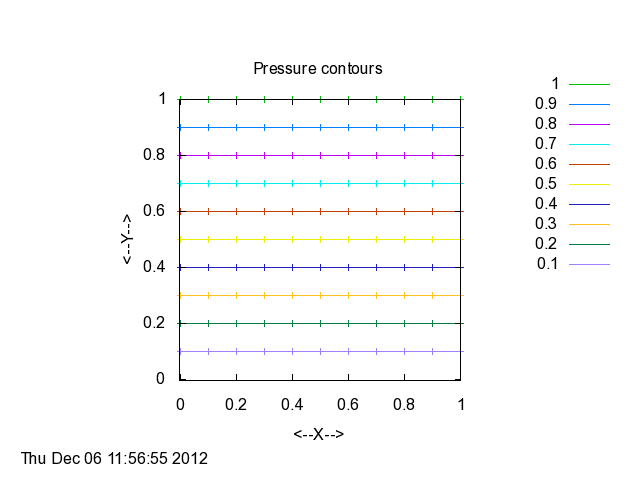
P makes a contour line plot of pressure data:
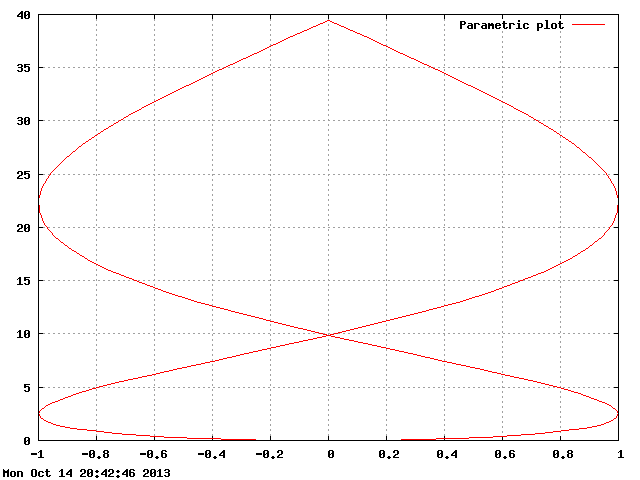
PARAMETRIC makes a parametric plot:
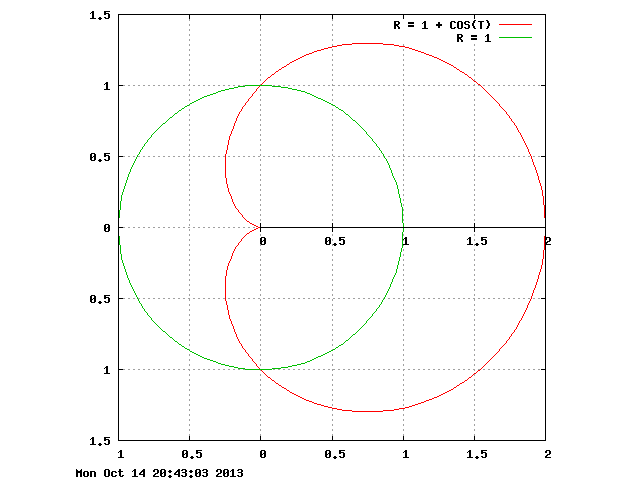
POLAR makes a polar plot:
POWERS counts integers 1 to 10, their squares, and square roots:
RANGES controls the range of a plot:
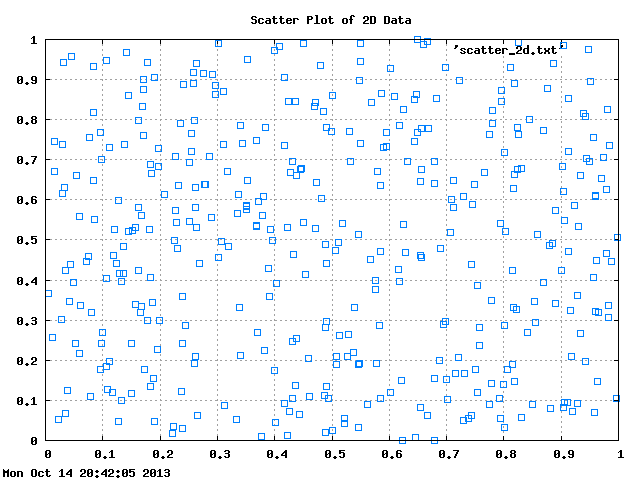
SCATTER_2D makes a scatter plot of X, Y data:
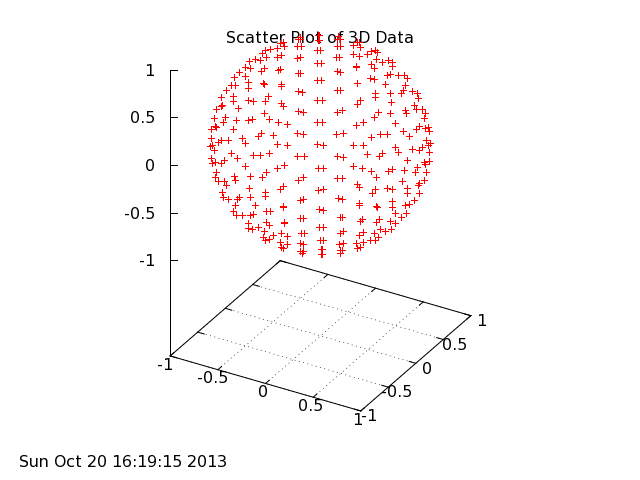
SCATTER_3D makes a scatter plot of X, Y, Z data (which happens to lie on a sphere).
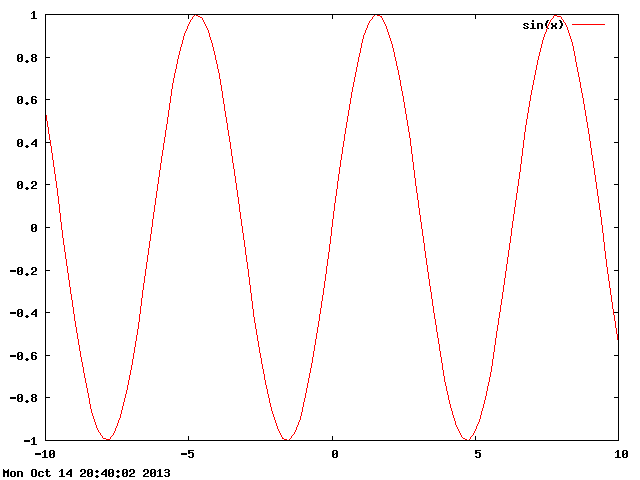
SINE_CURVE plots y=sin(x):
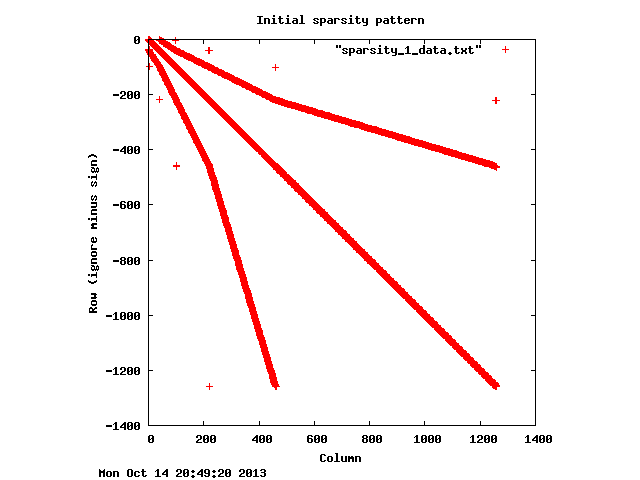
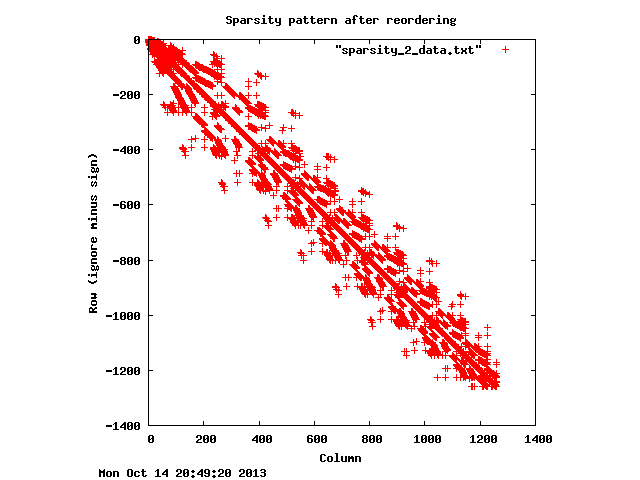
SPARSITY displays the sparsity pattern of a matrix before and after reordering. Notice that, because of differing conventions in (I,J) matrix indexing and (X,Y) Cartesian display, our data file is set up so that, if entry (I,J) is nonzero, we store the value (J,-I). In this way, the plot "looks" like the matrix.
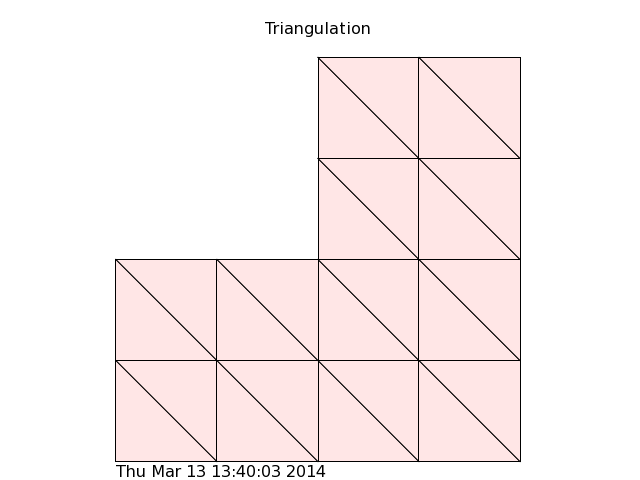
TRIANGULATION is a plot of a triangulation.
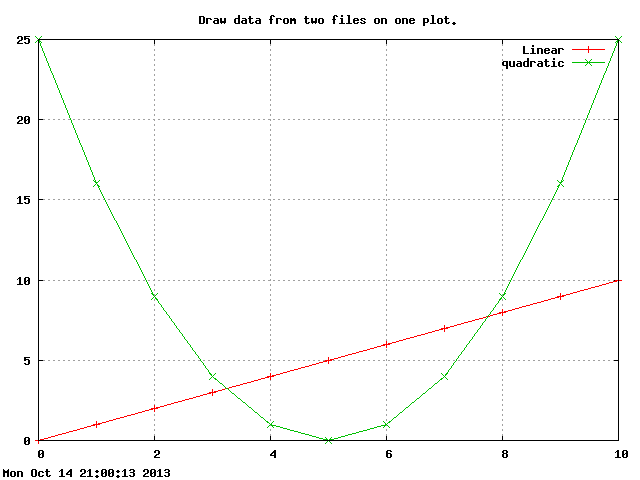
TWO_FILES plots data from two files together:
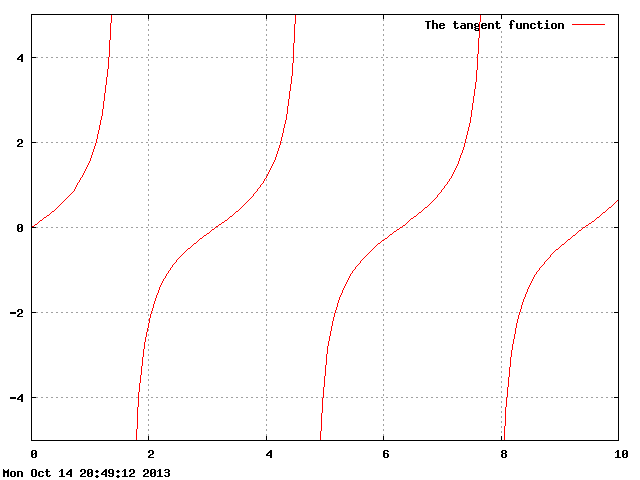
TWO_PLOTS plots two functions together:
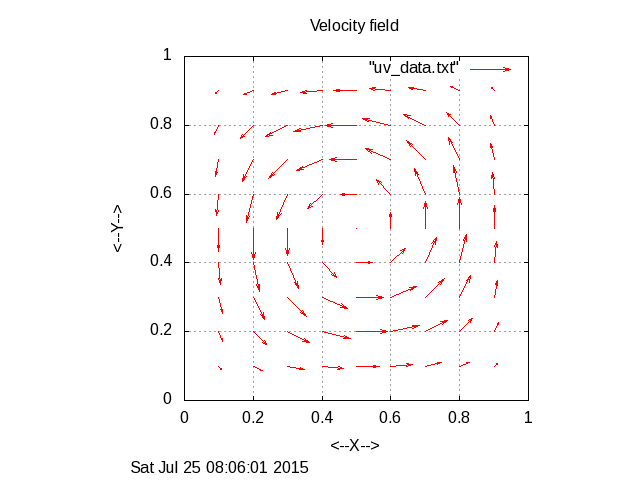
UV makes a vector plot of velocity data:
You can go up one level to the EXAMPLES directory.