Animations
| > | anim1 := (r,a,n) -> animate( plotPQR, [ theta, r, a ], theta=0..2*Pi, frames=n, background=P1(r,a,n), args[4..-1] ): |
| > | anim1p := (r,a,n) -> animate( plotPQR, [ theta, r, a ], theta=0..2*Pi, frames=n, background=P1p(r,a,n), args[4..-1] ): |
| > |
| > | anim1p( 1, 1, 21, scaling=constrained ); # circles Q and R plotted as discrete samples of points |
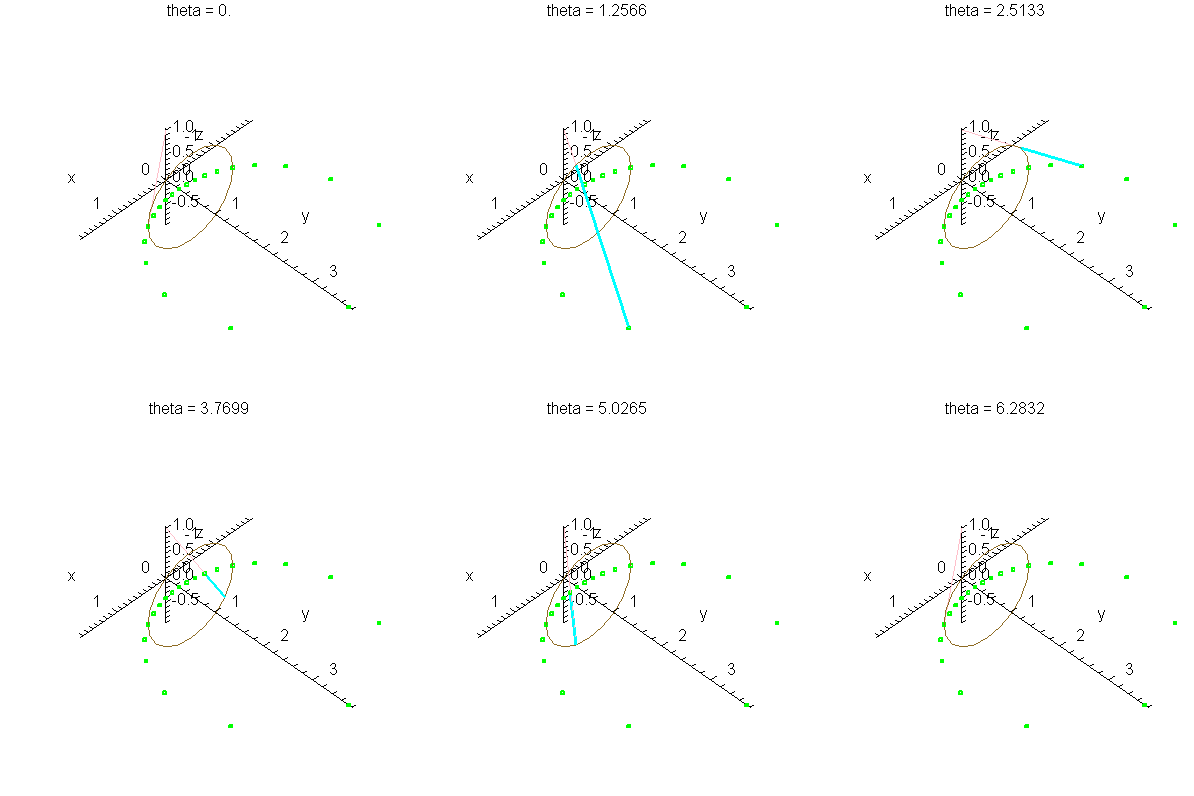
| > | anim1( 1, 1, 21, scaling=constrained ); # circles Q and R plotted as circles |
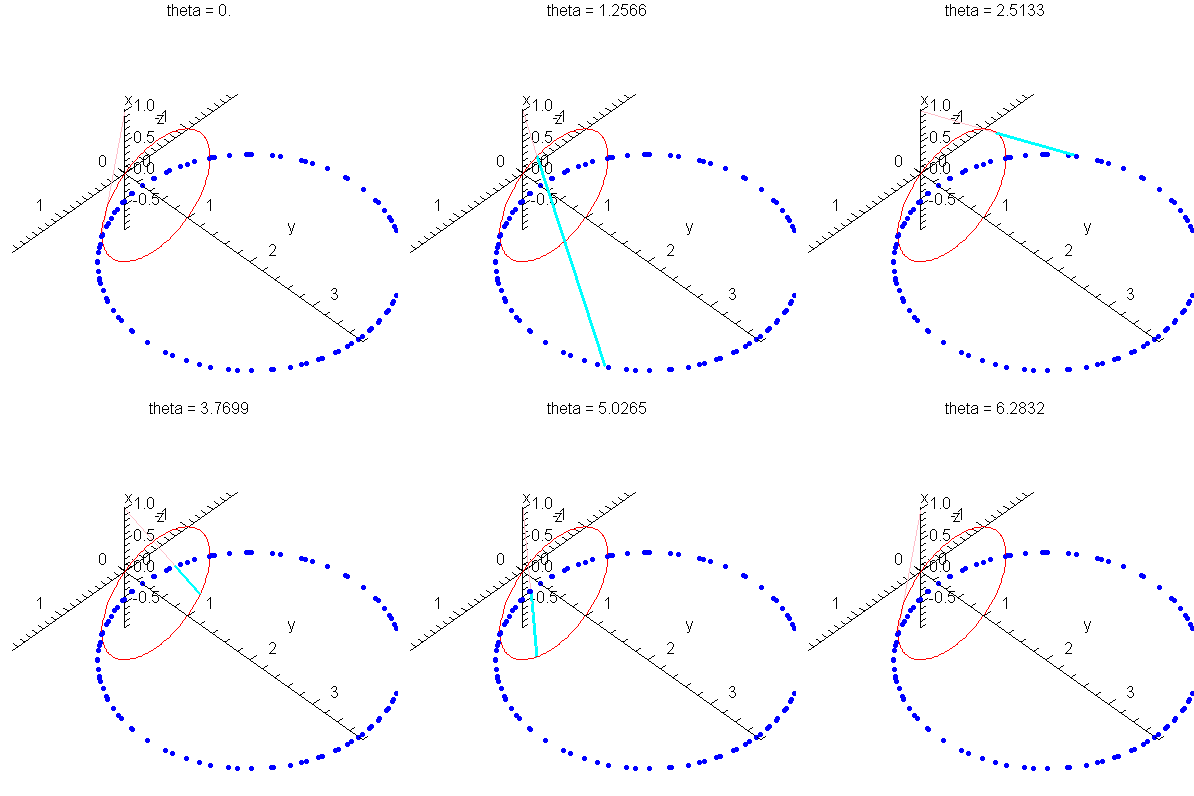
| > |
| > | anim1p( 1, 2, 21, scaling=constrained ); # circles Q and R plotted as discrete samples of points |
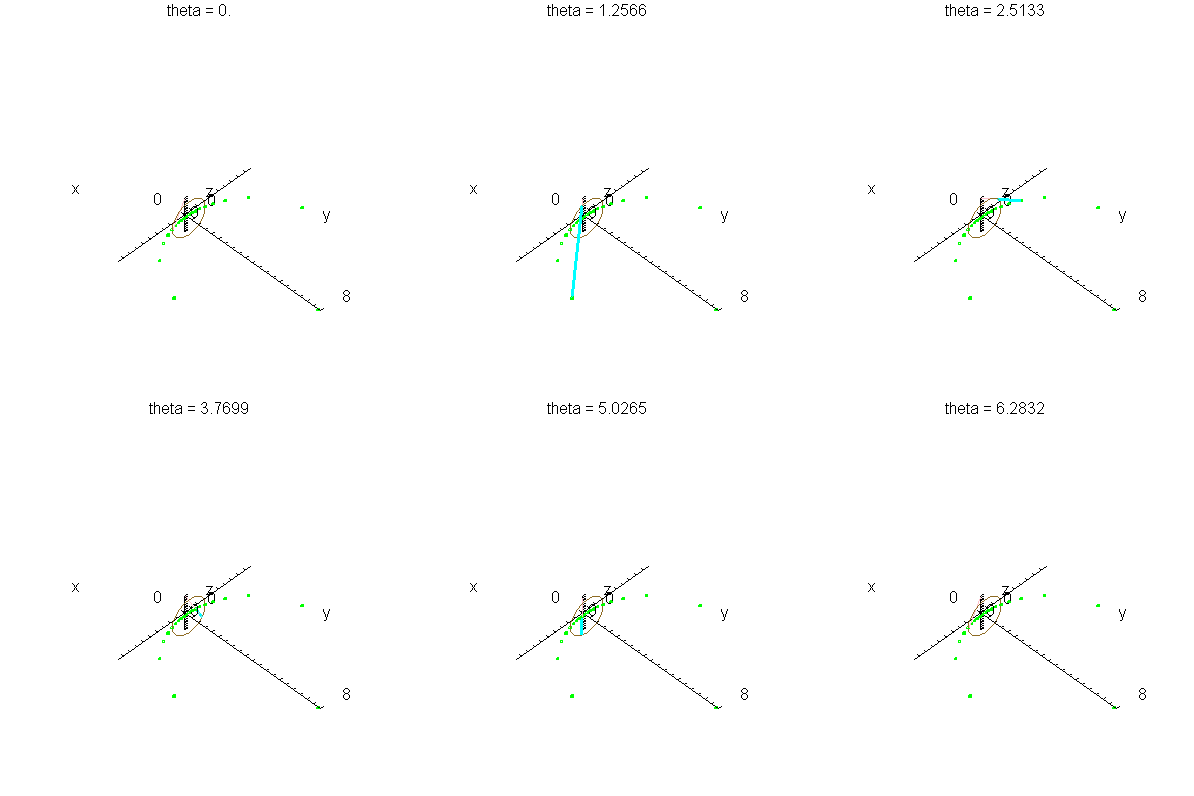
| > | anim1( 1, 2, 21, scaling=constrained ); # circles Q and R plotted as circles |
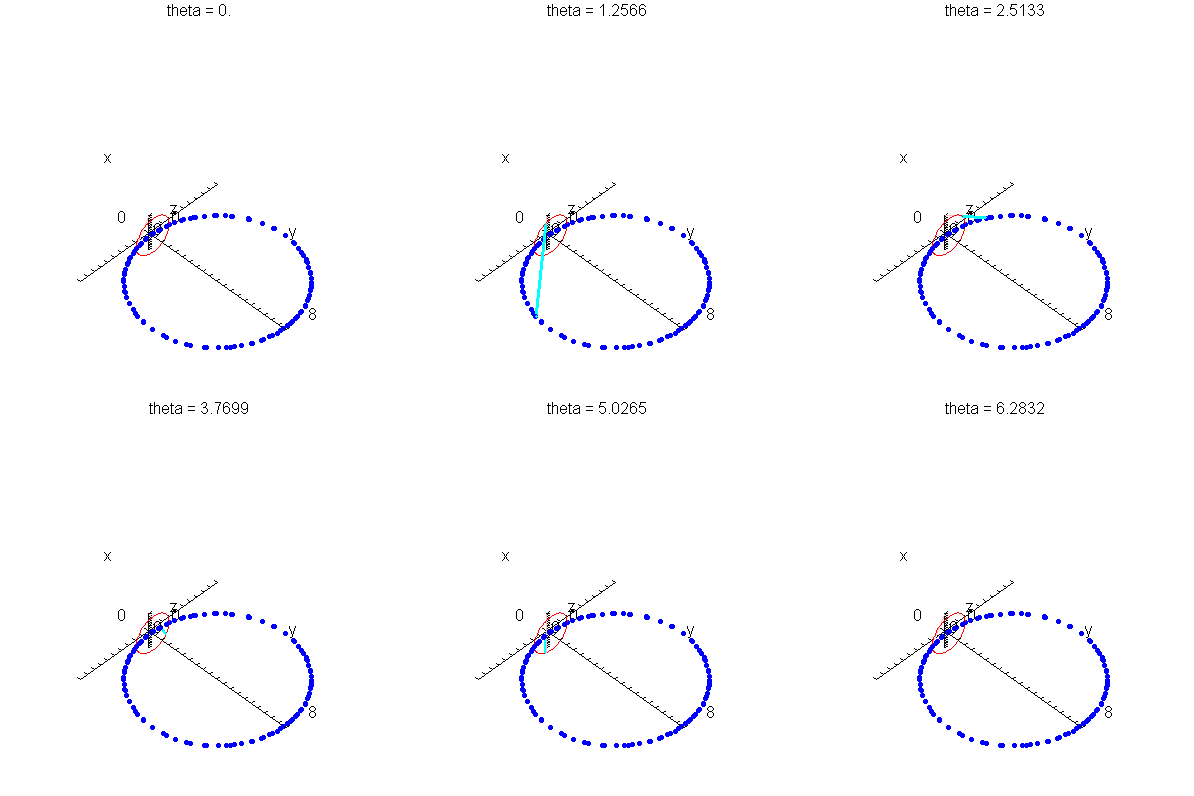
| > |
| > | anim1p( 1, 2, 41, scaling=constrained ); # circles Q and R plotted as discrete samples of points |
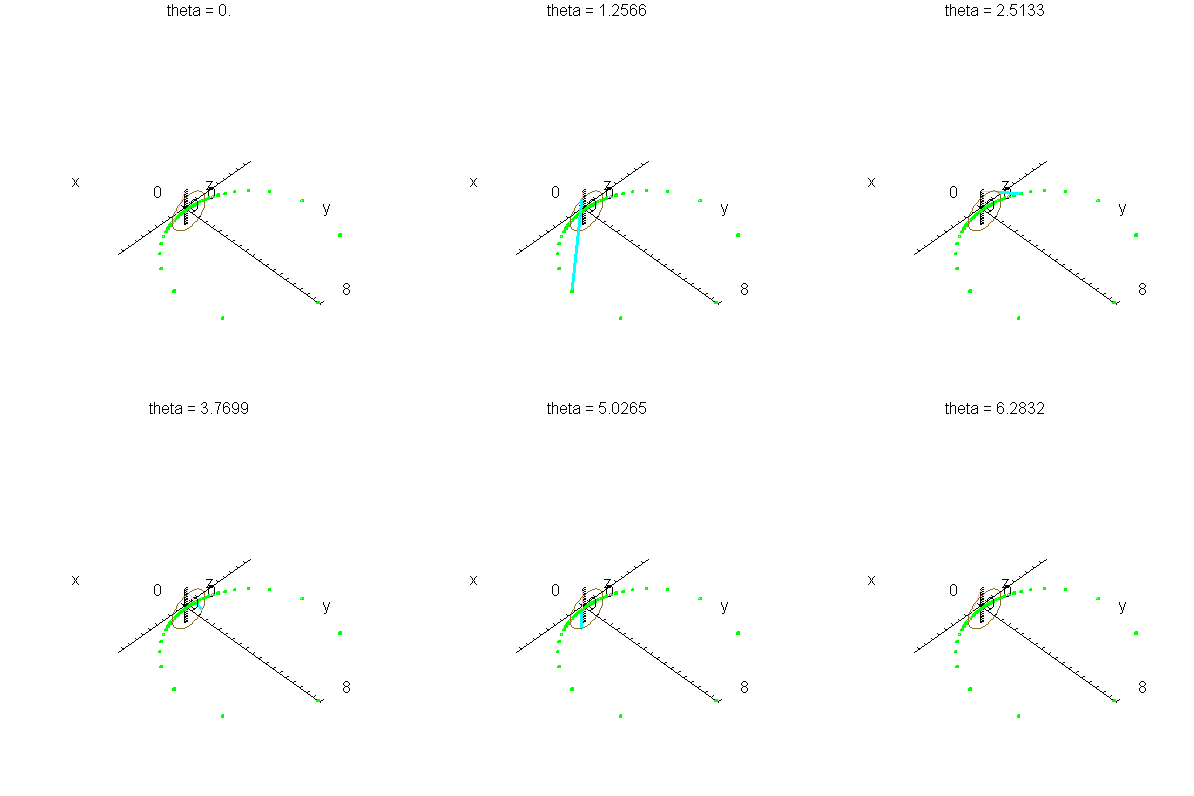
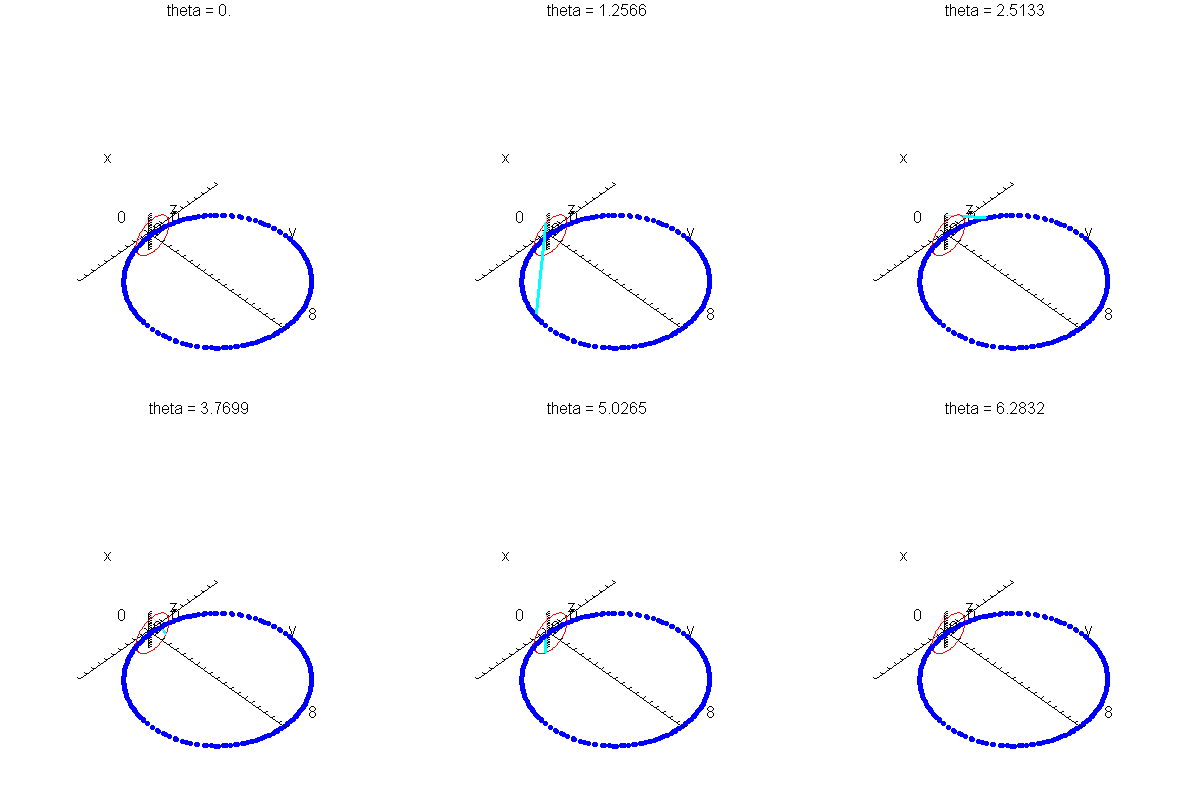
| > | anim1( 1, 2, 41, scaling=constrained ); # circles Q and R plotted as circles |
| > |
| > |