PLOT_POINTS
Plot points
PLOT_POINTS
is a FORTRAN90 program which
reads data in the XY file format
and creates an
Encapsulated PostScript file.
In fact, PLOT_POINTS can read data in the more general
TABLE file format, allowing the user to select the two coordinates
that will play the role of X and Y.
Plots you can make include:
-
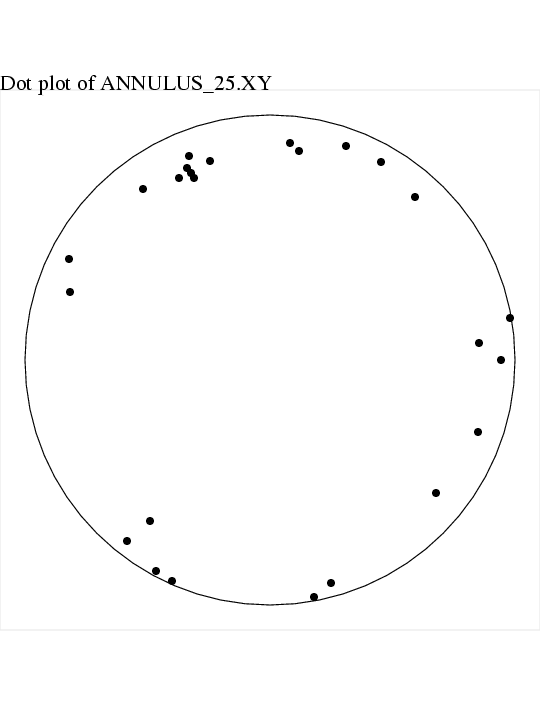
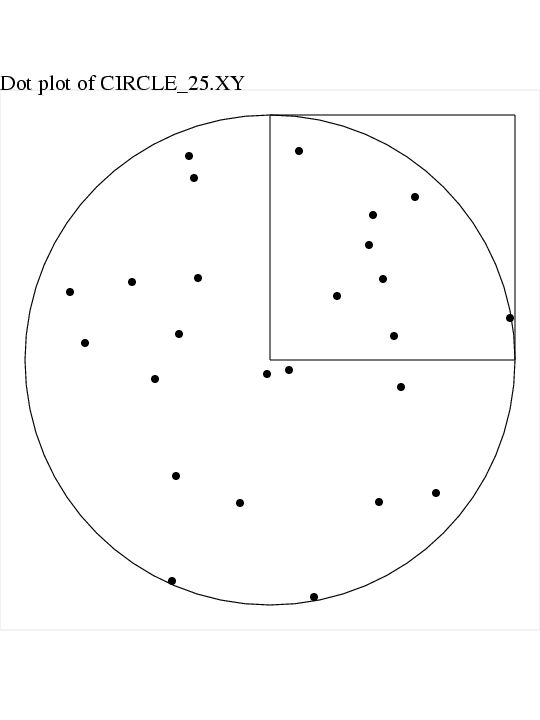
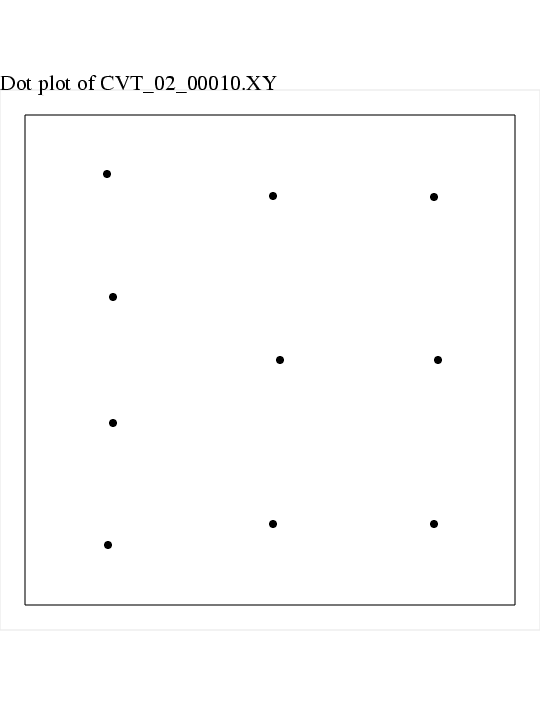
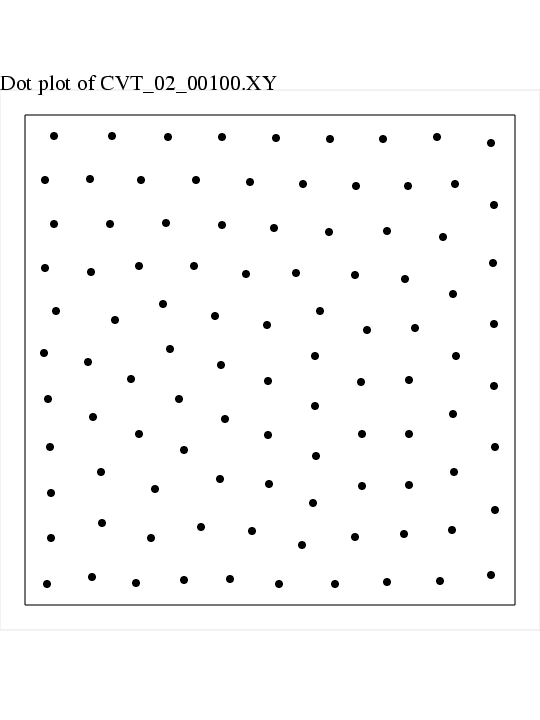
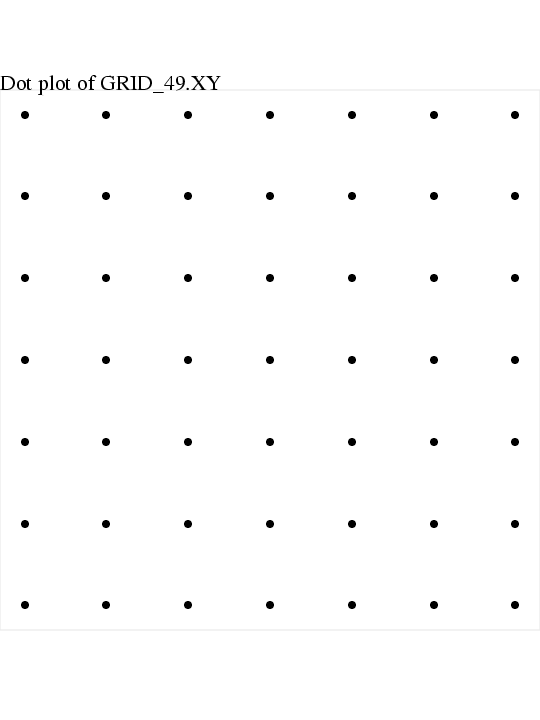
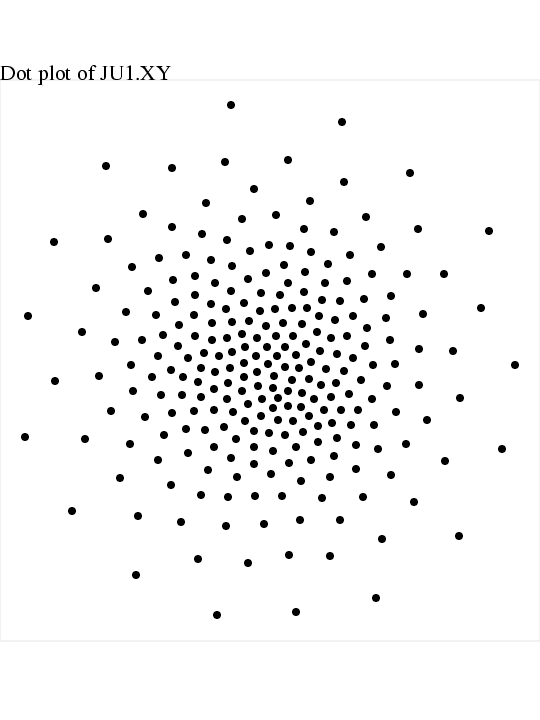
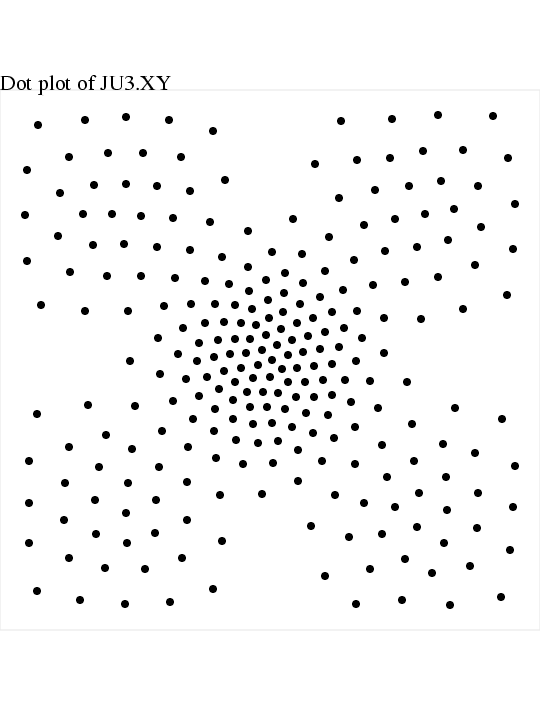
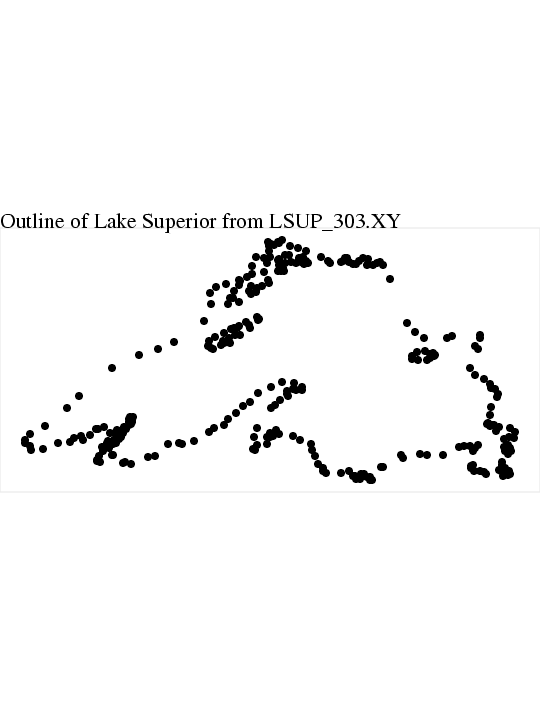
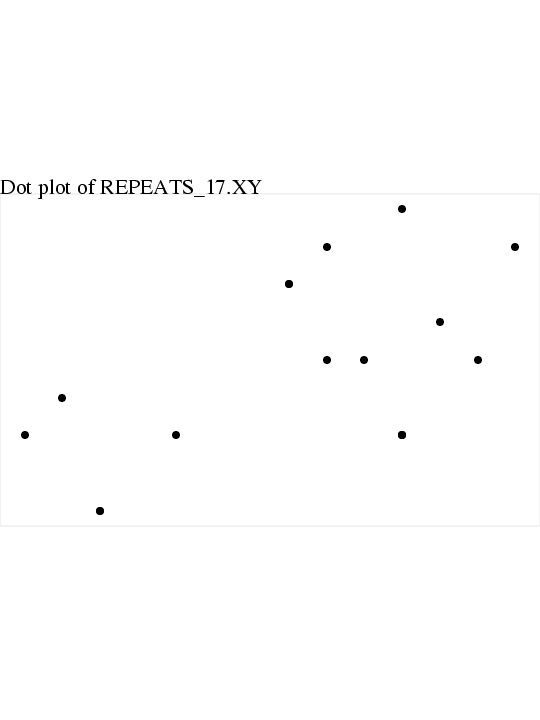
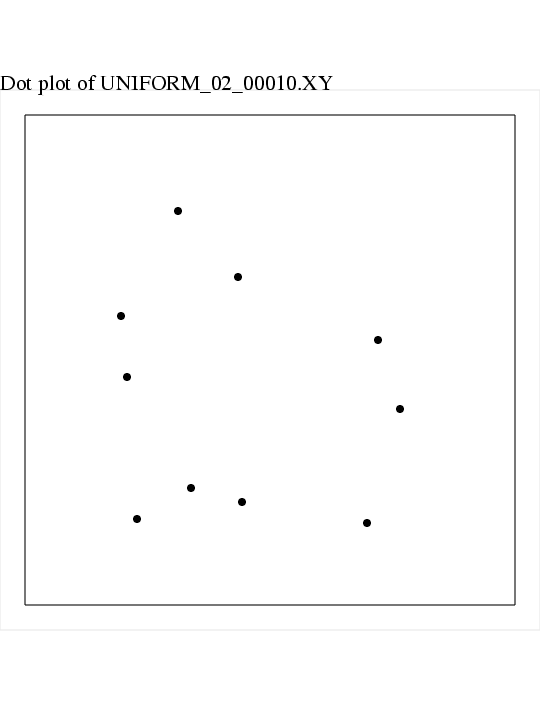
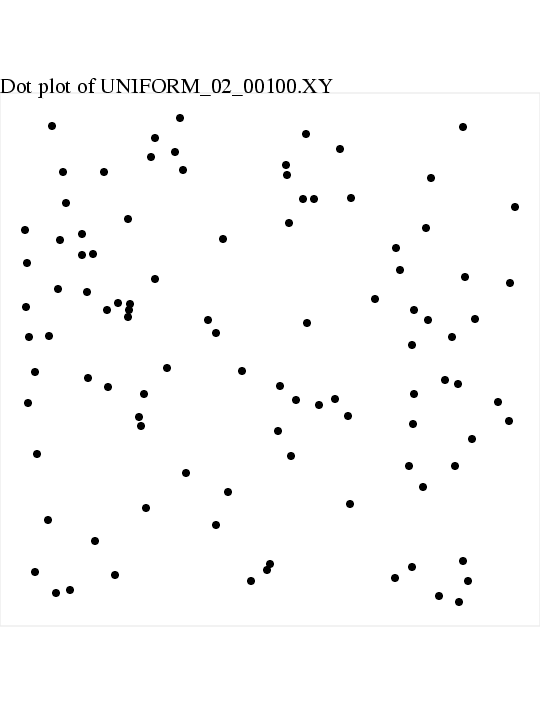
a dot plot of the points,
-
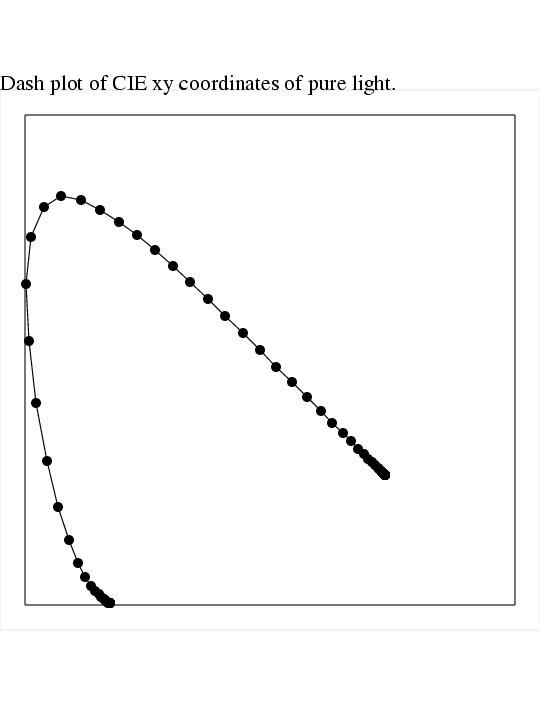
the line formed by connecting consecutive points
(great for displaying Brownian motion),
-
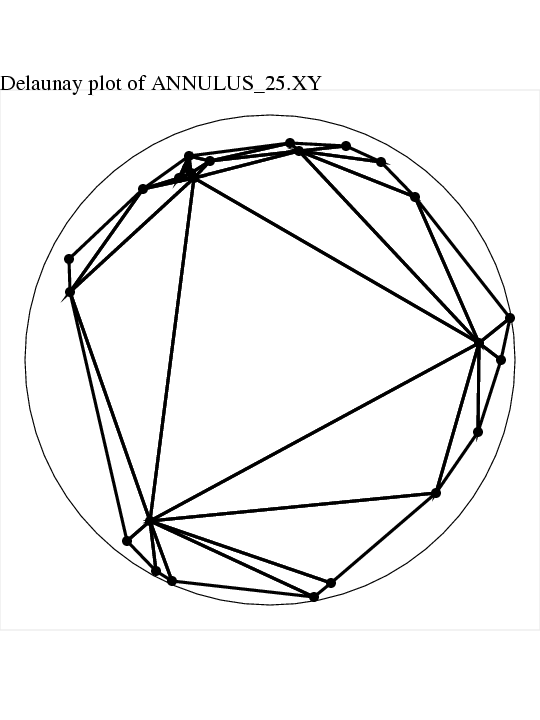
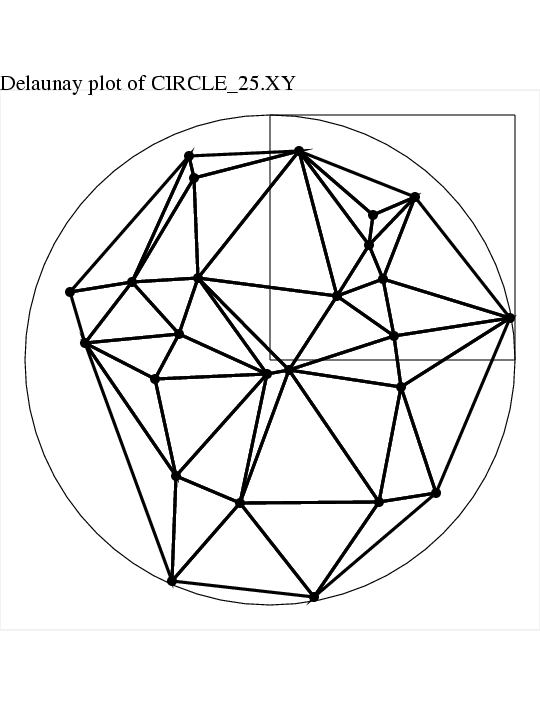
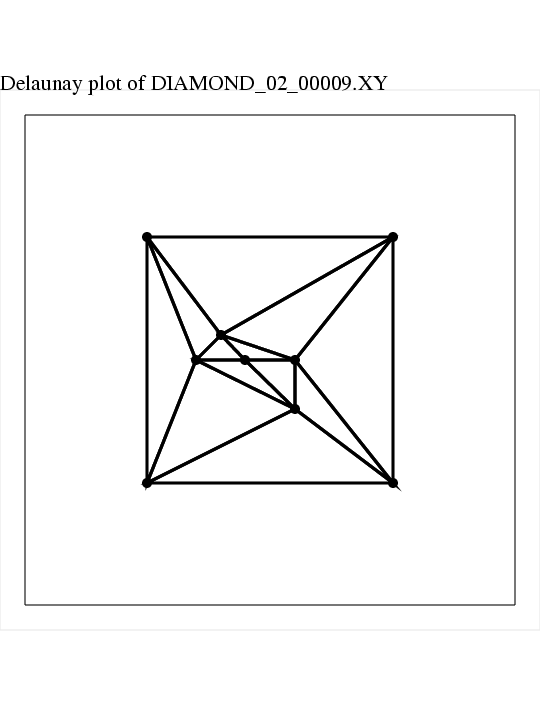
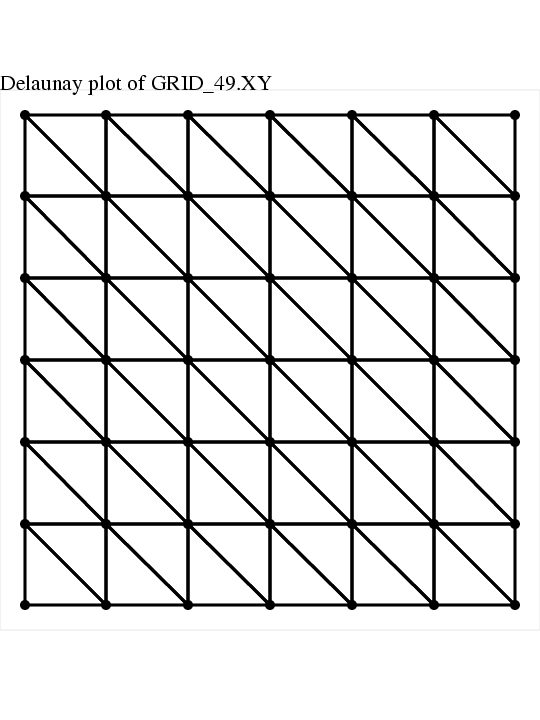
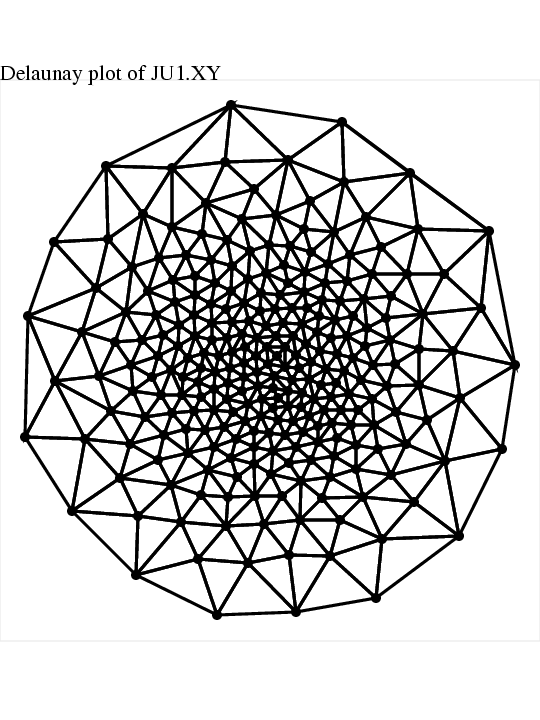
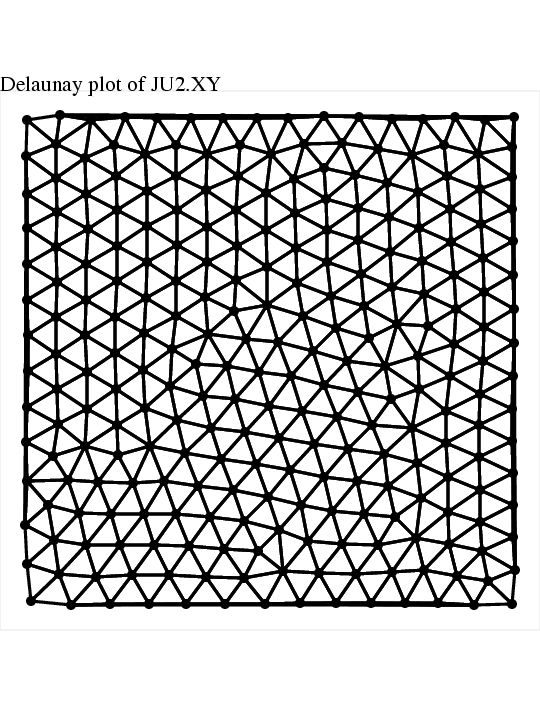
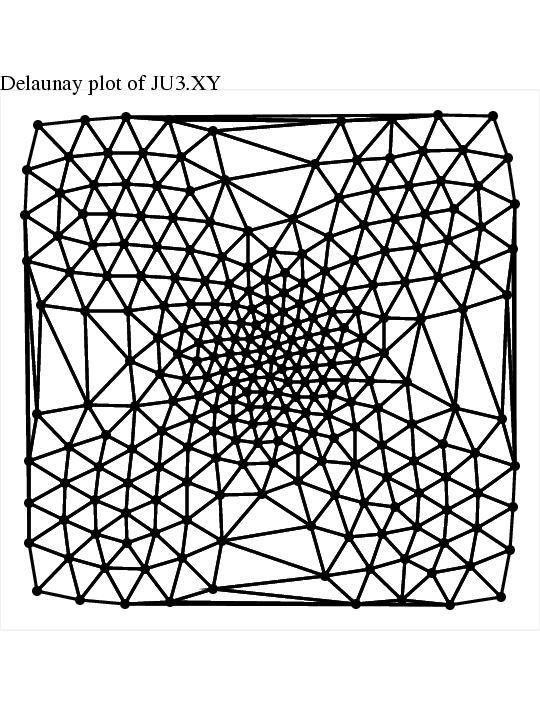
the Delaunay triangulation of the points,
-
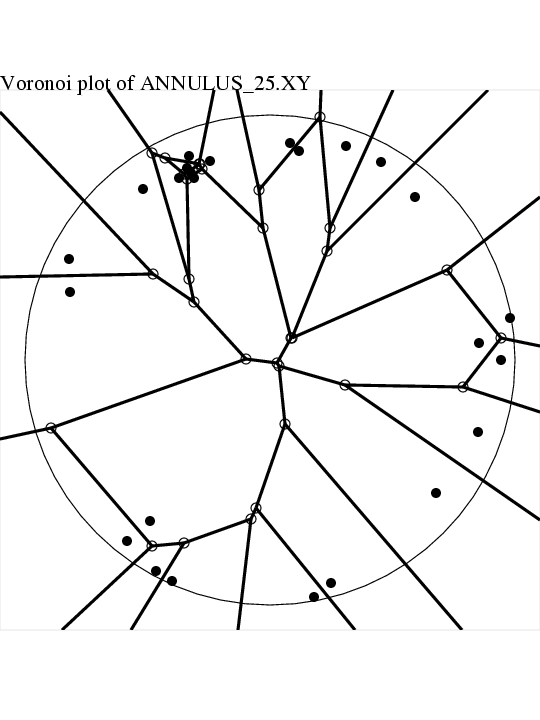
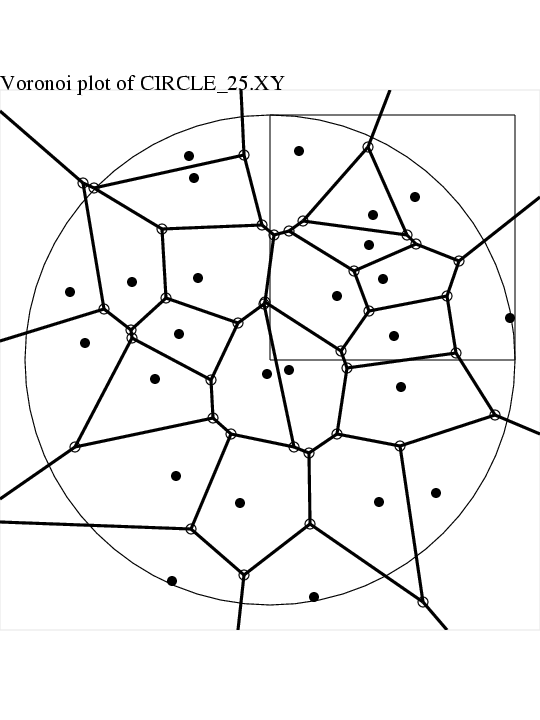
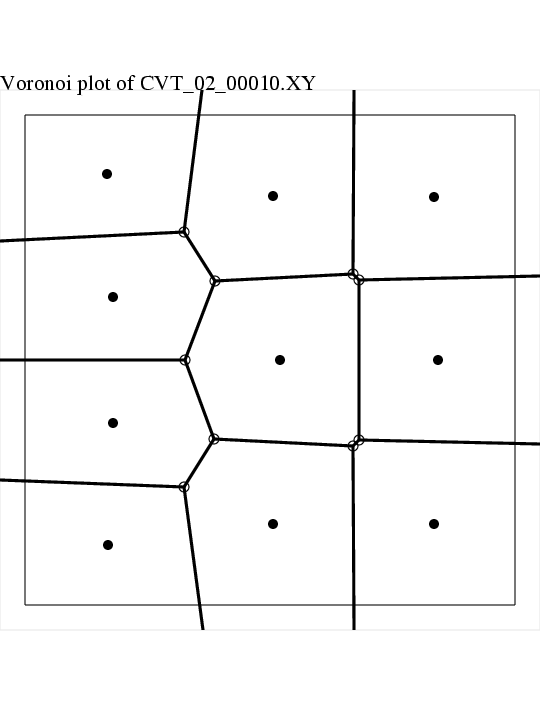
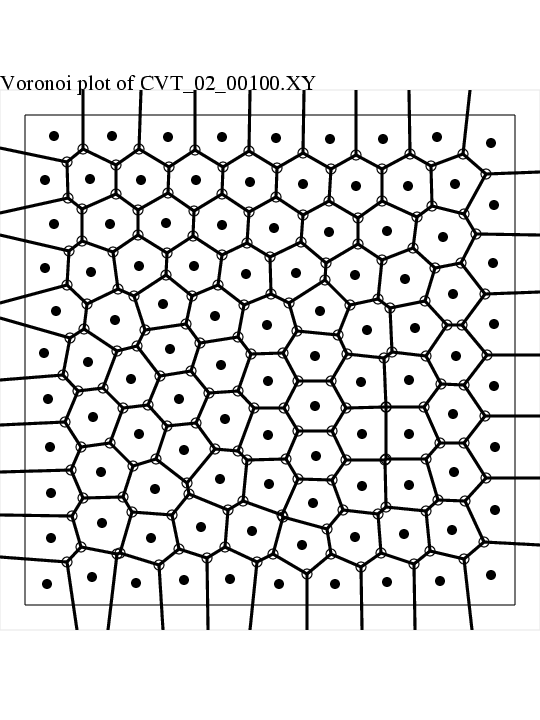
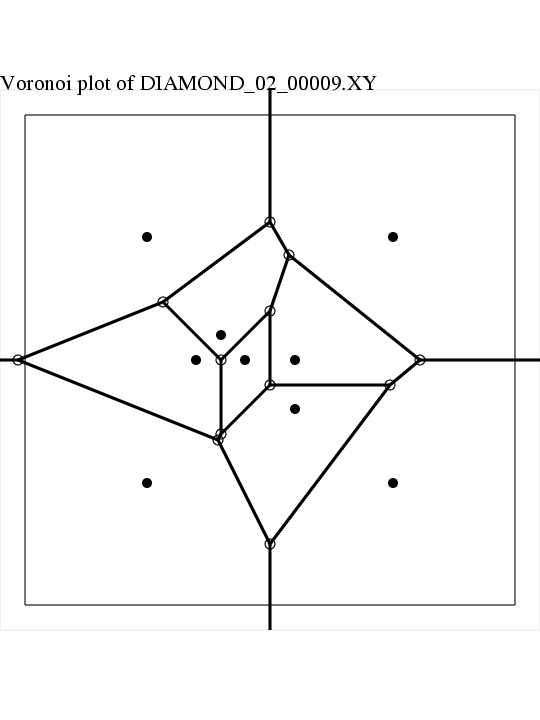
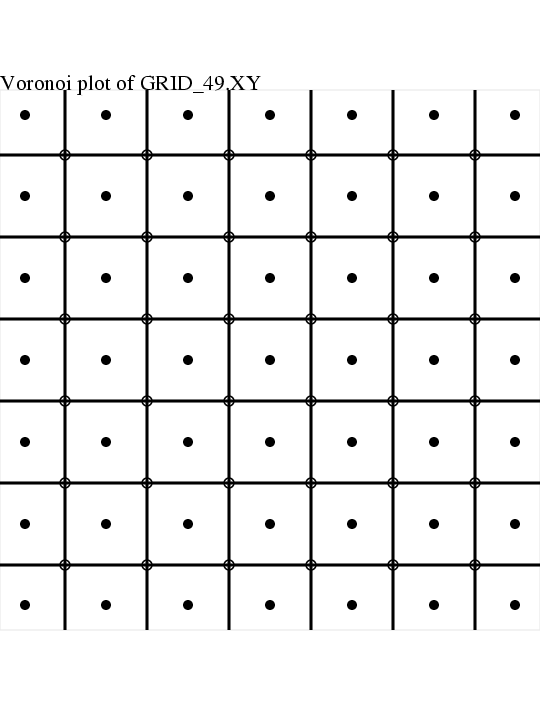
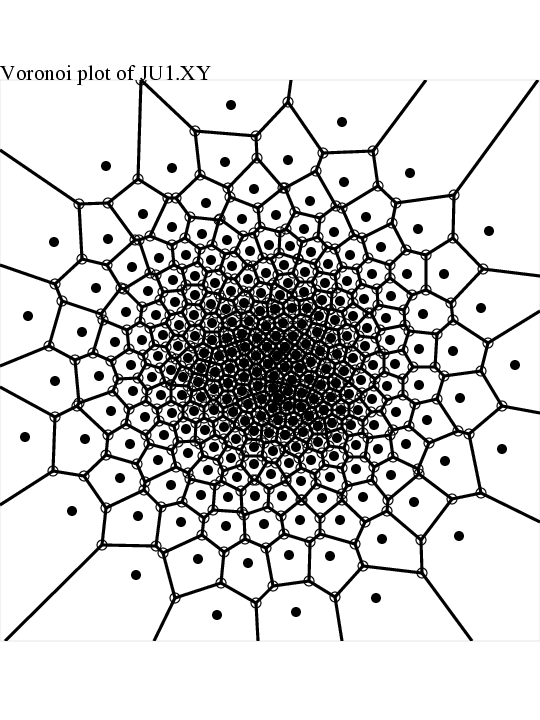
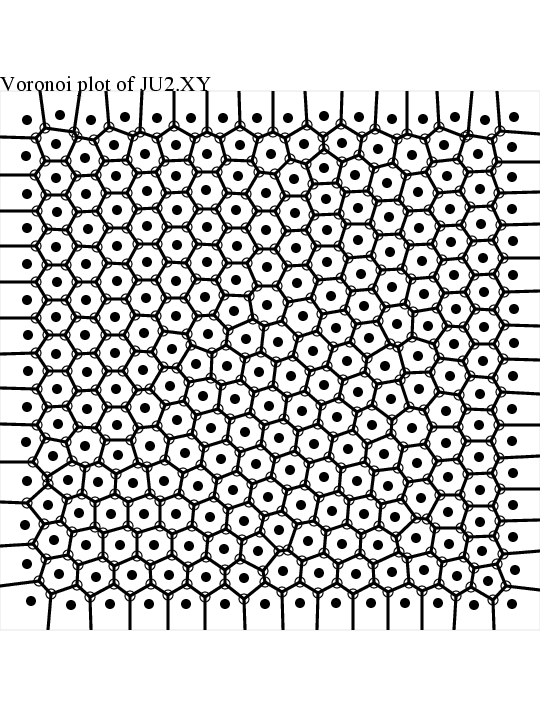
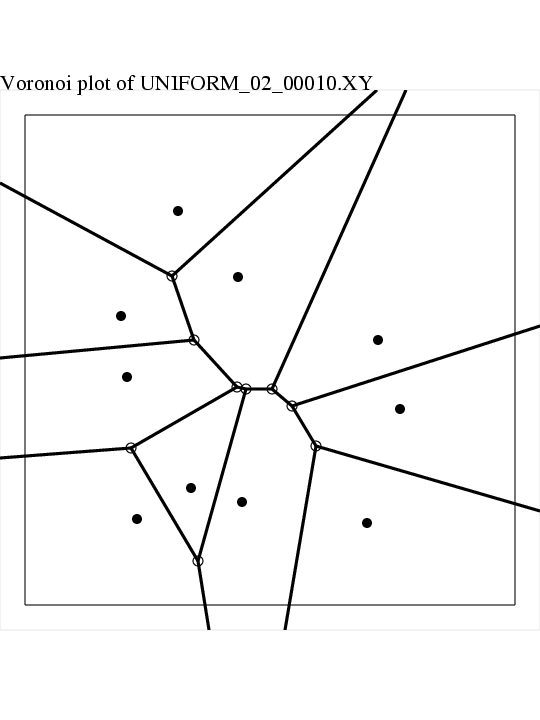
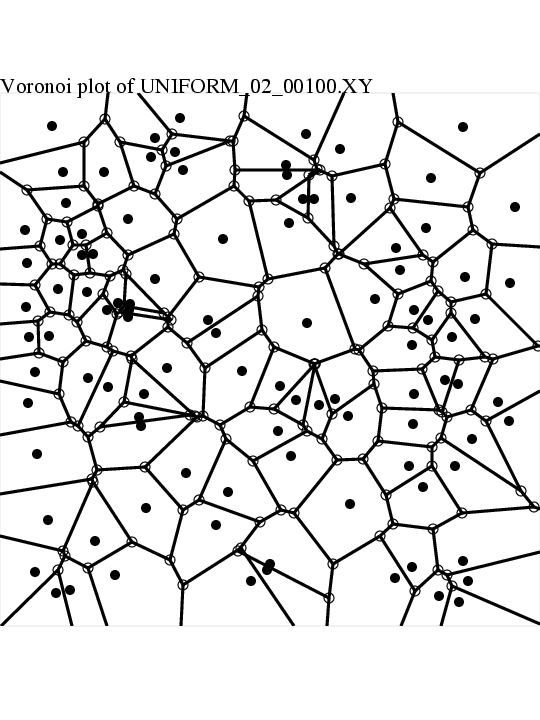
the Voronoi diagram,
-
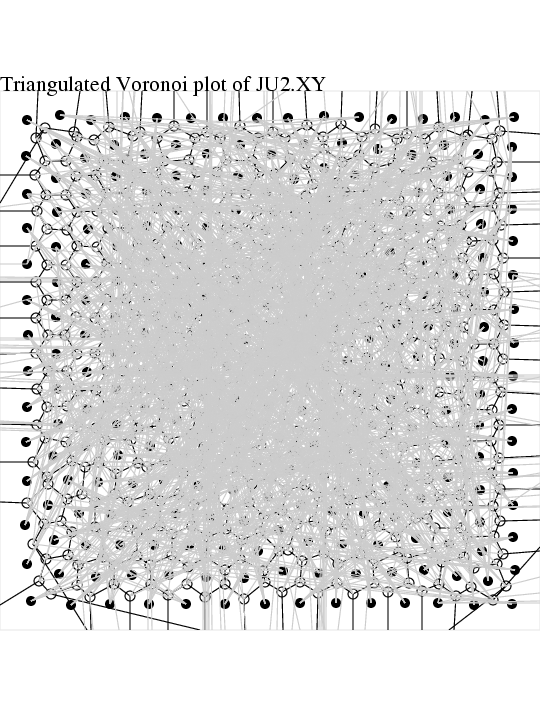
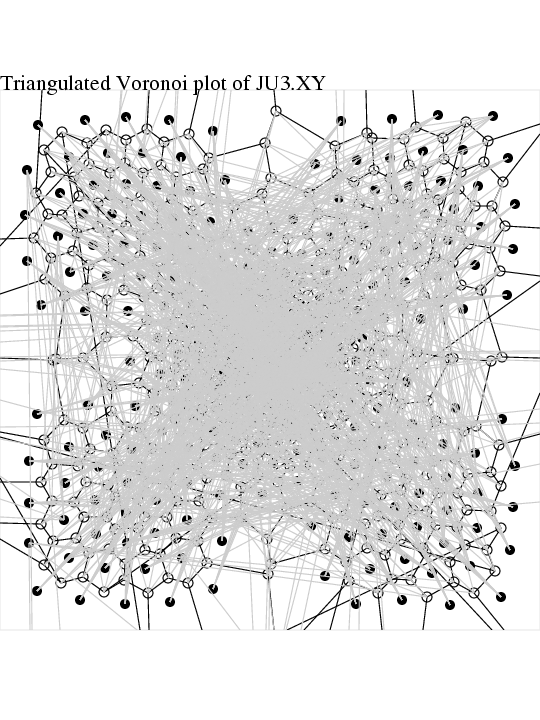
the triangulated Voronoi polygons.
-
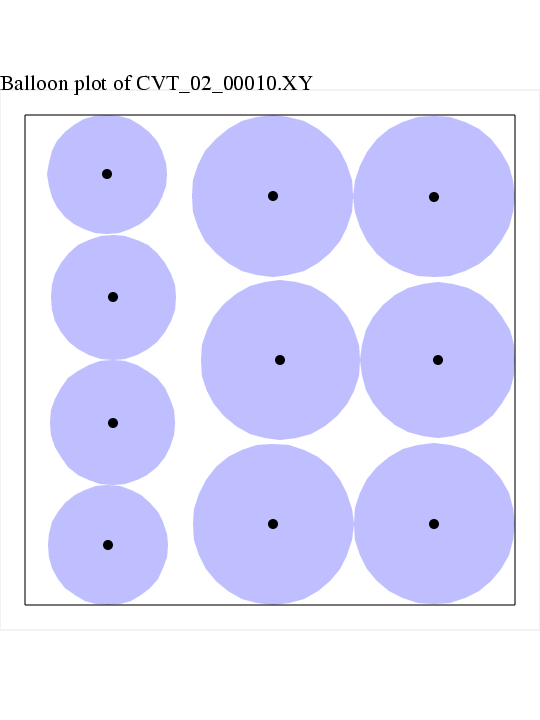
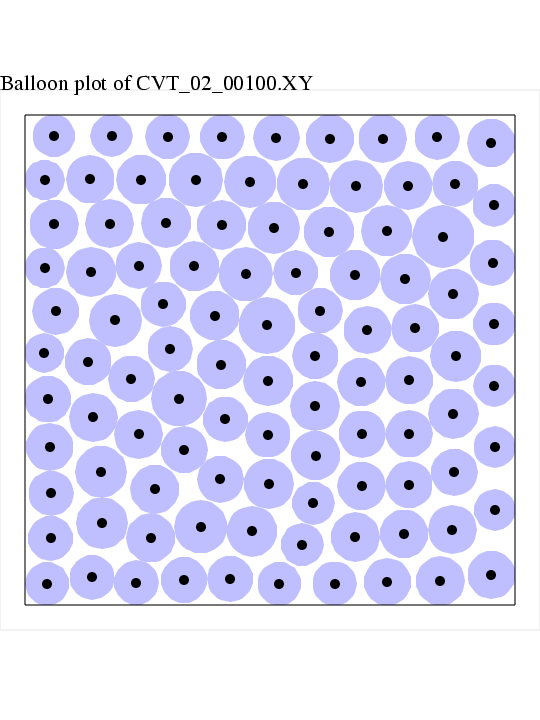
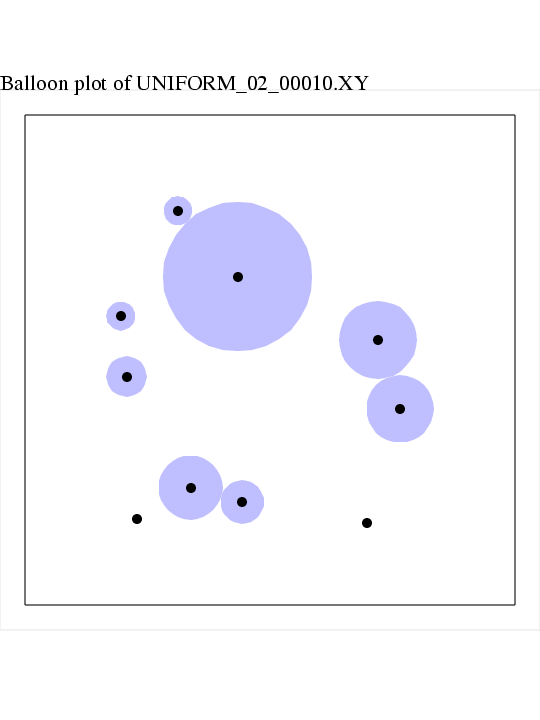
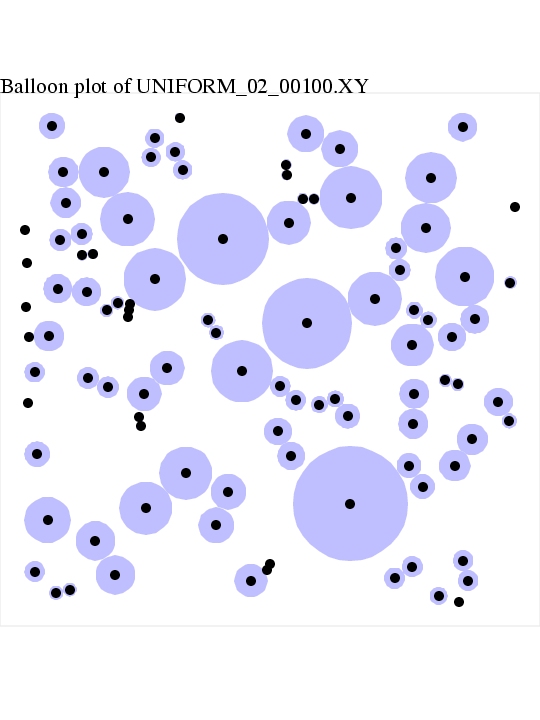
a balloon plot of the points, in which each point is
surrounded by a maximal circle that does not intersect
the others. (assumes the points lie in [0,1] x [0,1]).
You can specify the input file, add one box or circle, specify
the kind of plot to be made, and a few other options, by entering
commands interactively. The set of commands can be gotten
via the "HELP" command. The full list is:
| command | Meaning |
|---|
| BALLOON | a "balloon" plot of points. |
| DASH | dash plot of connected points. |
| DOT | dot plot of points. |
| DEL | Delaunay triangulation plot |
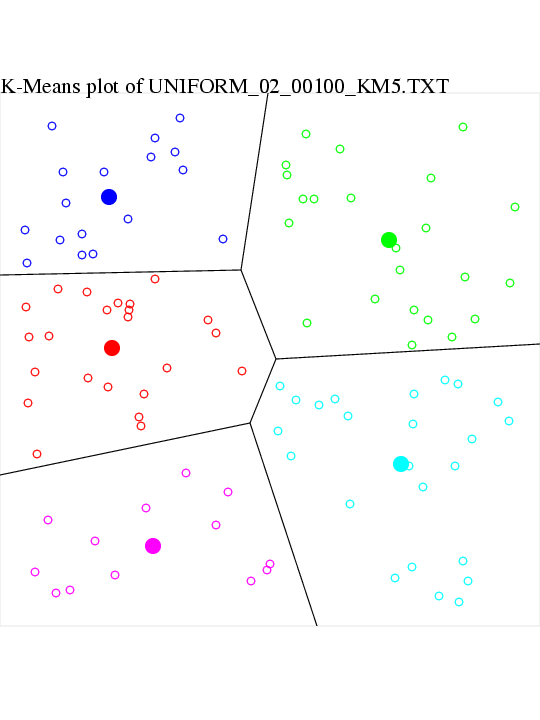
| KM | K-Means plot. |
| TH | thin the points. |
| TV | triangulated Voronoi diagram. |
| VOR | Voronoi diagram plot. |
| Q | quit. |
| READ filename | read another input file. |
| OUTPUT filename | name the next output file. |
| BOX x1 y1 x2 y2 | draw a single box in the plot. |
| NOBOX | do not draw a box in the plot. |
| CIRCLE x y r | draw a single circle in the plot. |
| NOCIRCLE | do not draw a circle in the plot. |
| MARKER_SIZE = n | Specify marker size. |
| SHADOW | mark X and Y axes for each point. |
| TITLE | enter a title for the next plot. |
| X = n | specify data index to use as X. |
| Y = n | specify data index to use as Y. |
| # comment | make a comment. |
Licensing:
The computer code and data files described and made available on this web page
are distributed under
the GNU LGPL license.
Languages:
PLOT_POINTS is available in
a FORTRAN90 version
Related Data and Programs:
BOX_PLOT,
a MATLAB program which
can color in specified entries of
a checkerboard, corresponding to pairs of integer data.
PS_WRITE,
a FORTRAN90 library which
is used by PLOT_POINTS.
XY_DISPLAY,
a MATLAB program which
can read a file of coordinates of points, and display an image of the
points in a MATLAB graphics window.
XY_DISPLAY_OPENGL,
a C++ program which
can read a file containing 2D point coordinates, and display
an image of those points using Open GL.
Reference:
-
Barry Joe,
GEOMPACK - a software package for the generation of meshes
using geometric algorithms,
Advances in Engineering Software,
Volume 13, pages 325-331, 1991.
-
Henry McGilton, Mary Campione,
PostScript by Example,
Addison-Wesley,
ISBN: 0-201-63228-4
Source Code:
Examples and Tests:
ANNULUS_25 is 25 points in an annulus:
BROWNIAN_100 is 100 points of simulated Brownian motion,
created by
the RANDOM_DATA program:
CIE_XY_81 is 81 points of CIE (x,y) coordinates for pure light,
created by a sample program that uses
the COLORS library:
CIRCLE_25 is 25 points on a circle:
CVT_02_00010 is a set of 10 points in 2D, generated by
a centroidal Voronoi Tessellation program, and part of the
CVT dataset:
CVT_02_00100 is a set of 100 points in 2D, generated by
a centroidal Voronoi Tessellation program, and part of the
CVT dataset:
DIAMOND_09 is 9 points whose Voronoi diagram contains one
cell whose vertices are known exactly, and which looks roughly
like a diamond:
GRID_49 is a set of 49 points in a grid:
JU1 is Lili Ju's first data set. Lili Ju gave me some data sets
to analyze with this program. The data represents certain
centroidal Voronoi tessellation generators, using certain density
functions.
JU2 is Lili Ju's second data set:
JU3 is Lili Ju's third data set:
LSUP_303 is 303 points that outline Lake Superior:
REPEATS_17 is a set of 17 points with some repeated:
UNIFORM_02_00010 is a set of 10 points in 2D, generated by
a uniform random number generator, and part of the
UNIFORM dataset:
UNIFORM_02_00100 is a set of 100 points in 2D, generated by
a uniform random number generator, and part of the
UNIFORM dataset:
UNIFORM_02_00100_KM5 is a set of 100 points in 2D, generated by
a uniform random number generator, and organized into 5 clusters
using the
KMEANS program:
List of Routines:
-
AA_POINT_DATA_MODULE keeps track of some point data.
-
MAIN is the main program for PLOT_POINTS.
-
ANGLE_CONTAINS_RAY_2D determines if an angle contains a ray, in 2D.
-
ANGLE_DEG_2D returns the angle swept out between two rays in 2D.
-
ANGLE_TO_RGB returns a color on the perimeter of the color hexagon.
-
BALLOON_PLOT plots points with maximal nonintersecting circles.
-
BOX_CLIP_LINE_2D uses a box to clip a line segment in 2D.
-
BOX_RAY_INT_2D: intersection ( box, ray ) in 2D.
-
CH_CAP capitalizes a single character.
-
CH_EQI is a case insensitive comparison of two characters for equality.
-
CH_IS_DIGIT returns .TRUE. if a character is a decimal digit.
-
CH_TO_DIGIT returns the integer value of a base 10 digit.
-
CIRCLE_POINTS returns N equally spaced points on a circle in 2D.
-
DASH_PLOT plots a set of points, and connects them.
-
DATA_READ reads the point data from a file.
-
DELAUNAY_PLOT plots the Delaunay triangulation of a pointset.
-
DIAEDG chooses a diagonal edge.
-
DIGIT_INC increments a decimal digit.
-
DIGIT_TO_CH returns the character representation of a decimal digit.
-
DOT_PLOT makes a plot of a set of points.
-
DTRIS2 constructs a Delaunay triangulation of 2D vertices.
-
EPS_FILE_HEAD writes header information to an encapsulated PostScript file.
-
EPS_FILE_TAIL writes trailer information to an encapsulated PostScript file.
-
FILE_COLUMN_COUNT counts the number of columns in the first line of a file.
-
FILE_COLUMN_RANGE determines the minimum and maximum ranges of each column.
-
FILE_NAME_EXT_GET determines the "extension" of a file name.
-
FILE_NAME_EXT_SWAP replaces the current "extension" of a file name.
-
FILE_NAME_INC generates the next filename in a series.
-
GET_UNIT returns a free FORTRAN unit number.
-
I4_LOG_2 returns the integer part of the logarithm base 2 of |I|.
-
I4_MODP returns the nonnegative remainder of integer division.
-
I4_SWAP swaps two integer values.
-
I4_TO_ANGLE maps integers to points on a circle.
-
I4_TO_RGB maps integers to RGB colors.
-
I4_WRAP forces an integer to lie between given limits by wrapping.
-
I4MAT_TRANSPOSE_PRINT prints an I4MAT, transposed.
-
I4MAT_TRANSPOSE_PRINT_SOME prints some of the transpose of an I4MAT.
-
I4VEC_HEAP_D reorders an array of integers into a descending heap.
-
I4VEC_INDICATOR sets an integer vector to the indicator vector.
-
I4VEC_SORT_HEAP_A ascending sorts an integer array using heap sort.
-
I4VEC_SORTED_UNIQUE gets the unique elements in a sorted integer array.
-
KMEANS_PLOT plots a K-Means diagram.
-
LINE_EXP2IMP_2D converts an explicit line to implicit form in 2D.
-
LINE_EXP_NORMAL_2D computes the normal to a line in 2D.
-
LINES_EXP_INT_2D determines where two explicit lines intersect in 2D.
-
LINES_IMP_INT_2D determines where two implicit lines intersect in 2D.
-
LRLINE determines if a point is left of, right or, or on a directed line.
-
PERM_INV inverts a permutation "in place".
-
PLOT_SIZE determines a plot range.
-
POINT_INSIDE_BOX_2D determines if a point is inside a box in 2D.
-
POINTS_AVOID_POINT_ND checks if a point is "far" from a set of points in ND.
-
POINTS_COUNT counts the valid point coordinates in a file.
-
POINTS_READ reads point coordinates from a file.
-
POINTS_THIN "thins" points that are too close to each other.
-
PS_CIRCLE draws a circle.
-
PS_CIRCLE_FILL draws a filled circle.
-
PS_CLIP defines a clipping polygon.
-
PS_COLOR_FILL_SET sets the fill color.
-
PS_COLOR_LINE handles the line color.
-
PS_COLOR_LINE_SET sets the line color.
-
PS_COMMENT inserts a comment into the PostScript file.
-
PS_DEFAULT sets the internal settings to their default values
-
PS_FILE_CLOSE closes a PostScript file.
-
PS_FILE_OPEN opens a new version of a PostScript file with a given name.
-
PS_FONT_SIZE sets the font size.
-
PS_LABEL prints a label at the current position.
-
PS_LINE draws a line segment from (X1,Y1) to (X2,Y2).
-
PS_LINE_CLOSED adds the graph of a closed line to a PostScript file.
-
PS_LINE_WIDTH sets the line width.
-
PS_MARK_CIRCLE marks a point with a small open circle.
-
PS_MARK_DISK marks a point with a small filled disk.
-
PS_MARK_POINT marks a point with a tiny point.
-
PS_MOVETO "moves to" a new point, which becomes the current point.
-
PS_PAGE_HEAD writes header information on a new page.
-
PS_PAGE_TAIL writes tail information at the end of a page.
-
PS_POLYGON_FILL adds a filled polygon to a PostScript file.
-
PS_SETTING_INT sets, gets, or prints integer internal PS_WRITE parameters.
-
PS_SETTING_REAL sets, gets, or prints real internal PS_WRITE parameters.
-
PS_TRIANGLE draws an open triangle.
-
R8_SWAP swaps two R8's.
-
R82VEC_PERMUTE permutes an R82VEC in place.
-
R82VEC_SORT_HEAP_INDEX_A does an indexed heap ascending sort of an R82VEC.
-
R8MAT_TRANSPOSE_PRINT prints an R8MAT, transposed.
-
R8MAT_TRANSPOSE_PRINT_SOME prints some of an R8MAT, transposed.
-
R8MAT2_INVERSE inverts a 2 by 2 real matrix using Cramer's rule.
-
R8MAT_SOLVE uses Gauss-Jordan elimination to solve an N by N linear system.
-
RADIANS_TO_DEGREES converts an angle from radians to degrees.
-
RADIUS_MAXIMUS finds the biggest possible nonintersecting sphere.
-
S_BLANK_DELETE removes blanks from a string, left justifying the remainder.
-
S_CAP replaces any lowercase letters by uppercase ones in a string.
-
S_EQI is a case insensitive comparison of two strings for equality.
-
S_INDEX_LAST finds the LAST occurrence of a given substring.
-
S_TO_I4 reads an I4 from a string.
-
S_TO_R8 reads an R8 from a string.
-
S_TO_R8VEC reads an R8VEC from a string.
-
S_WORD_COUNT counts the number of "words" in a string.
-
SWAPEC swaps diagonal edges until all triangles are Delaunay.
-
TIMESTAMP prints the current YMDHMS date as a time stamp.
-
TIMESTRING writes the current YMDHMS date into a string.
-
TRIANGLE_CIRCUMCENTER_2D computes the circumcenter of a triangle in 2D.
-
TRIANGULATION_ORDER3_PRINT prints out information defining a Delaunay triangulation.
-
TRIVOR_PLOT plots the triangulated Voronoi diagram of a set of points in 2D.
-
VBEDG determines which boundary edges are visible to a point.
-
VORONOI_PLOT plots the Voronoi diagram of a set of points in 2D.
You can go up one level to
the FORTRAN90 source codes.
Last revised on 28 January 2009.