BAR_PLOT is a FORTRAN90 library which makes simple bar plots from data.
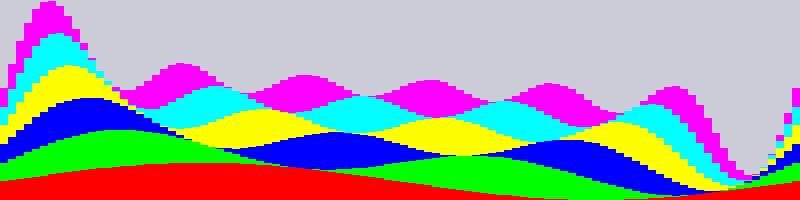
At the moment, the library contains only one "interesting" routine, BAR_DATA_TO_RGB, which assumes that the user wants to make a sort of bar plot. At a number of equally spaced X values, a set of Y values have been supplied, which are all nonnegative. Moreover, the Y values have been scaled so that the maximum sum (or height of the bar) over any X is 1 (or less).
BAR_DATA_TO_RGB sets up RGB color arrays that indicate the appearance of the corresponding bar plot (with gray used for parts of the plot over which bars do not extend). The arrays can easily be plotted by calling, for example, the routine PPMA_WRITE from the PPMA_IO graphics library.
In turn, a PPMA file can be turned into a number of other useful formats. For example, the CJPEG routine can convert such a file to JPEG files, and these can be displayed on web pages or turned into an animation using QuickTime Pro. (This is exactly the direction in which I intend to go with this software.)
The computer code and data files described and made available on this web page are distributed under the GNU LGPL license.
BAR_PLOT is available in a FORTRAN90 version.
BOX_PLOT, a MATLAB program which can color in specified entries of a checkerboard, corresponding to pairs of integer data.
HISTOGRAM_DISPLAY, a MATLAB program which can read data and display a histogram of it.
PPMA_IO, a FORTRAN90 library which reads or writes ASCII Portable Pixel Map (PPM) files.
TABLE_HISTOGRAM, a FORTRAN90 program which reads a file of data and produces a histogram.
You can go up one level to the FORTRAN90 source codes.