USC Component of DoD, DoE and NASA Activities:
Graphical User Interfaces and Enabling Technologies.
G3D - A Graphical User Interface
for PDE Simulations
Visualization tools devised by the University of South Carolina
are used for assessment of simulations as well as for improving PICS
groundwater code and algorithm development. Primary effort has
focused on G3D (an integrated graphical user interface used for
post-processing simulations, for preprocessing models and 3D grid
generation) and modules which use the Tracking/Steering library to couple
to the simulators executing on remote parallel supercomputers:
- Groundwater simulation runs may be post-processed by G3D using various
standard features such as multiple slices/dices, time animation, multiple
isosurfaces with varying opacity, vectors, mouse control of view, opaque
display of material properties, various lighting models, multiple views,
and stereo rendering. VCR controls and key-framing are available for movie
generation and data archival.
![[Image of Graphical User Interface - G^3D]](http://www.math.sc.edu/~sharpley/GIF/g3d_hpc97_small.gif) (click here)
(click here)
- Grid Generation Features of G3D. The 3D grid creation/editing
tools have been developed to facilitate the incorporation of topographical
features, geological subsurface features, in addition to well data and
reference map overlays. Additional integrated features include
- manipulate and refine grids,
- specify heterogeneous model PDE coefficients and parameters (e.g.,
soil properties such as porosities, permeabilities, hydraulic conductivities,
...) which may be user-customized for general sets of model equations,
- set initial conditions for dependent solution variables (e.g., pressure
heads and concentrations) using either 3D patches which may be specified
by a constant value or computed using an integrated parser utility,
- specify time-dependent boundary conditions of all types through temporal-spatial
linked lists of boundary patches which are also fully edit-able and are
rendered in various ways to guarantee data integrity. The user may set
the dependent variable values by using G3D's integrated parser utility.
A number of auxillary tools have been produced to facilitate model development
by practicing hydrologists, as well as assisting in the development of
the GCT series of codes. I/O capabilities are also being incorporated for
user readable data as well as binary distributed files for the Paragon.
Prototype utilities also have provided access to GIS (Geographic Information
System) data bases to import grids from topographical surface measurements.
This prototype may be modified to assimilate stream levels and historical
contamination records as well as subsurface data for soil properties and
contaminant distribution.
Interactive Tracking and Steering Library.
In order to efficiently calibrate models, characterize contaminants and
media properties, and optimize remediation schemes, an interactive
capability is required. Typically, the modeler needs to observe the
effects of current parameter settings, and based on those observations,
they must then be permitted to alter the parameters in a non-intrusively
manner during the simulation. This methodology may also be used to test
and fine tune numerical algorithms for accuracy, robustness, and efficiency
without affecting load balancing.
![[Image of Interactive Controller for Parallel Machines]](http://www.math.sc.edu/~sharpley/GIF/ControlComp_small.gif)
The South Carolina component has developed a tracking and steering
library to connect parallel machines and workstations to enable this
functionality.
In this library the remote MPP machine is set as host with a graphics node
that handles requests from client workstations in such a manner so as not
to disturb the load-balance of the compute nodes (unless the applications
programmer so wishes). This node also uses the compression modules (see
below) and the XDR libraries with remote procedure calls to transfer the
data to the client workstation for processing and interactive analysis.
On-line Steering Library Manual.
3D Data Compression
Current bandwidths preclude the interactive simulation of large scale models
on remote supercomputers if even moderately sized data sets are to be
transfered for analysis or steering. The wavelet analysis research
group at the University of South Carolina have developed higher dimensional
multiresolution-based data compression and processing libraries
to enable efficient and effective assessment of interactive simulations
on massively parallel platforms.
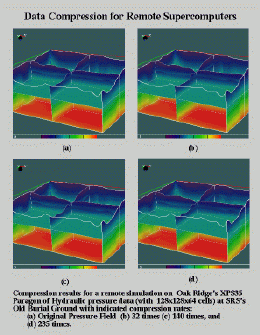
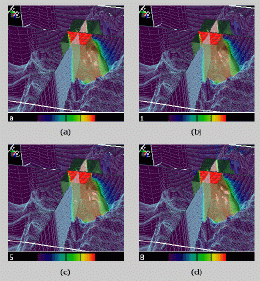
The following image (on the left) provides a comparison of the reconstructed
images from compressed files with high levels of compression for the original
simulated pressure field. The image on the right utilizes the enhanced
compression encoders applied to a contaminant transport data set with stronger
gradients.
3-D EZM Data Compression:
Original and Compressed Data

|
|
3D Data Compression Comparison
with rates from 172-1200

Comparison of compressed data to original scalar
field: (a) Original data, and compression rates of
(b) 172, (c) 493, and (d) 1200 times compression.
|
The figure on the right consists of images all rendered using identical
orthogonal slices and an isosurface of .3 of maximum concentration percentage.
Return
to PICS WEB Page
Return to Sharpley's
WEB Page
![[Image of Graphical User Interface - G^3D]](http://www.math.sc.edu/~sharpley/GIF/g3d_hpc97_small.gif)
![[Image of Interactive Controller for Parallel Machines]](http://www.math.sc.edu/~sharpley/GIF/ControlComp_small.gif)

