| > |
Maple Lab -- Supplement
Limits, Infinity, and Asymptotes
| > | restart; |
| > | with( plots ); |
Warning, the name changecoords has been redefined
![]()
![]()
![]()
![]()
![]()
| > | with( Student[Calculus1] ); |
![]()
![]()
![]()
![]()
| > |
Example 1: Asymptotes Command
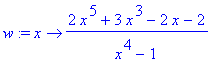
| > | w := x -> (2*x^5+3*x^3-2*x-2)/(x^4-1); |
| > | Pw := plot( w(x), x=-10..10, y=-20..20, discont=true ): |
| > | Pw; |
![[Maple Plot]](images/Asymptotes-supp11.gif)
| > | asym := Asymptotes( w(x), x ); |
![]()
| > | Pa1 := implicitplot( asym[1], x=-10..10, y=-20..20, linestyle=2 ): |
| > | Pa2 := implicitplot( {asym[2],asym[3]}, x=-10..10, y=-20..20, linestyle=3 ): |
| > | display( [ Pw, Pa1, Pa2 ] ); |
![[Maple Plot]](images/Asymptotes-supp13.gif)
| > |
Example 2: Horizontal Asymptotes
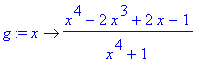
| > | g := x -> (x^4-2*x^3+2*x-1)/(x^4+1); |
| > | Pg := plot( g(x), x=-20..20 ): |
| > | Pg; |
![[Maple Plot]](images/Asymptotes-supp15.gif)
| > | q1 := limit( g(x), x=infinity ); |
![]()
| > | q2 := limit( g(x), x=-infinity ); |
![]()
| > | horiz := { q1, q2 }; |
![]()
| > | Ph := plot( horiz, x=-20..20, color=cyan ): |
| > | display( [ Pg, Ph ] ); |
![[Maple Plot]](images/Asymptotes-supp19.gif)
| > |
Example 3: Vertical Asymptotes
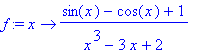
| > | f := x -> (sin(x)-cos(x)+1)/(x^3-3*x+2); |
| > | Pf := plot( f(x), x=-4..4, y=-10..10, discont=true ): |
| > | Pf; |
![[Maple Plot]](images/Asymptotes-supp21.gif)
| > | q1 := denom( f(x) ); |
![]()
| > | q2 := solve( q1=0, {x} ); |
![]()
| > | vert := { x=-2, x=1 }; |
![]()
| > | Pv := implicitplot( vert, x=-2*Pi..2*Pi, y=-20..20, color=blue ): |
| > | display( [ Pf, Pv ] ); |
![[Maple Plot]](images/Asymptotes-supp25.gif)
| > |
Note:
Demonstrate adding legend manually.
| > |
| > |
Example 4: Oblique Asymptotes (for Rational Functions)
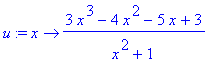
| > | u := x -> (3*x^3-4*x^2-5*x+3)/(x^2+1); |
| > | Pu := plot( u(x), x=-10..10 ): |
| > | Pu; |
![[Maple Plot]](images/Asymptotes-supp27.gif)
| > | q1 := numer( u(x) ); |
![]()
| > | q2 := denom( u(x) ); |
![]()
| > | q3 := quo( q1, q2, x ); |
![]()
| > | q4 := rem( q1, q2, x ); |
![]()
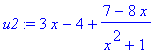
| > | u2 := q3 + q4/q2; |
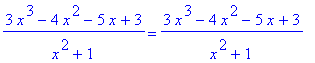
| > | u(x) = simplify( u2 ); |
| > | Po := plot( q3, x=-10..10, color=pink ): |
| > | display( [ Pu, Po ] ); |
![[Maple Plot]](images/Asymptotes-supp34.gif)
| > |
| > |
| > |