Math 141: Calculus I
DEMO 2
The picture below is an animated gif file produced with the aid of MAPLE (for making the pictures) and GifBuilder (for combining the pictures into an animated gif file). The graph is of y = x^2 from x = 0 to x = 4. The area under the curve is being approximated by rectangles below the curve. Observe that as the number of rectangles increases, the area shaded by the rectangles under the curve becomes a closer and closer fit for the area under the graph of y = x^2 from x = 0 to x = 4. (You may want to click on the link below to see the volume that is produced when 16 of these rectangles are revolved about the x-axis.)
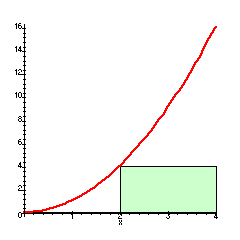
Rectangles filling the area under the curve y = x^2