This run of POD_BASIS takes the CAVITY_FLOW data and seeks 16 POD vectors.
Note, from the output file, the singular values associated with each POD vector, which indicate its relative importance:
| Vector | Singular value |
|---|---|
| 1 | 143.5181 |
| 2 | 67.9276 |
| 3 | 40.3419 |
| 4 | 14.3551 |
| 5 | 6.2452 |
| 6 | 3.5592 |
| 7 | 2.6394 |
| 8 | 2.3344 |
| 9 | 1.6844 |
| 10 | 1.0862 |
| 11 | 0.8761 |
| 12 | 0.4292 |
| 13 | 0.3543 |
| 14 | 0.1966 |
| 15 | 0.1397 |
| 16 | 0.0908 |
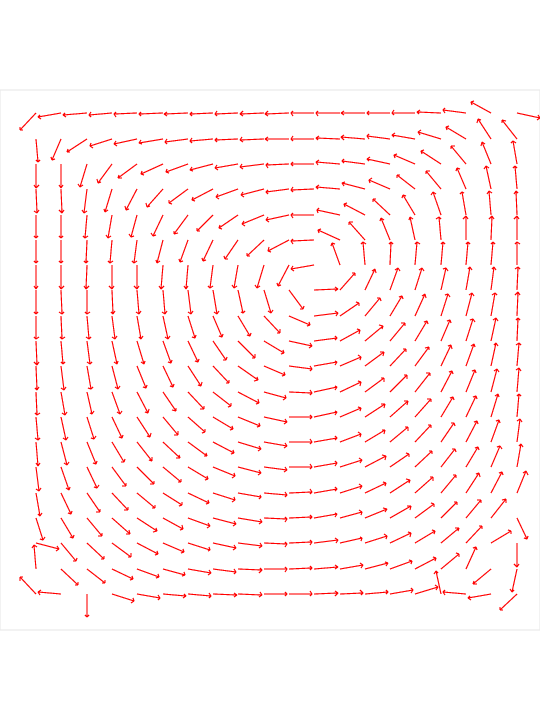
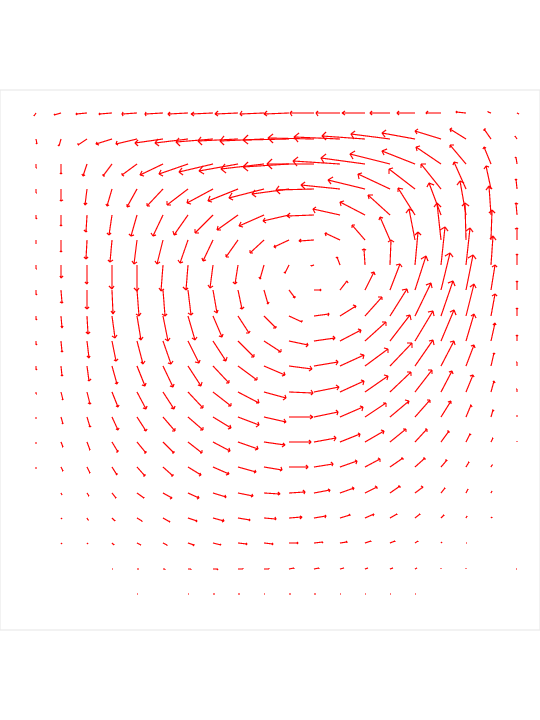
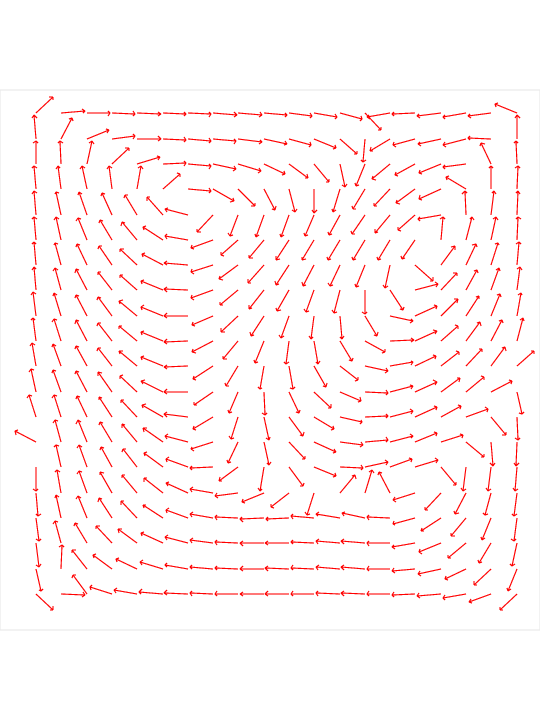
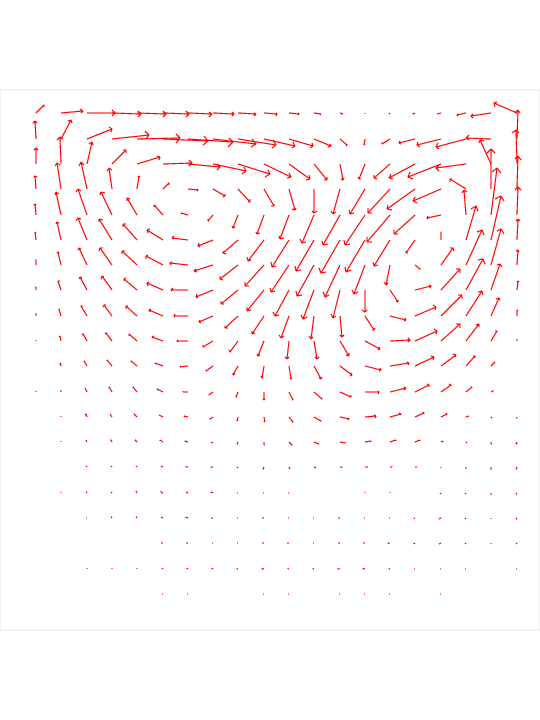
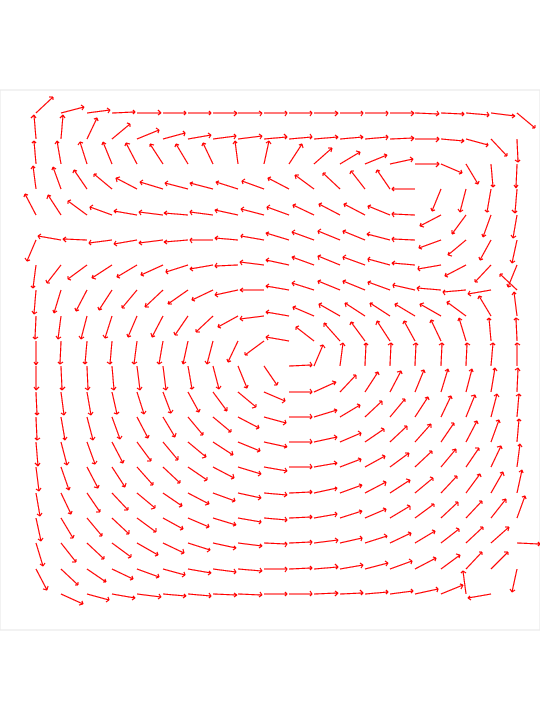
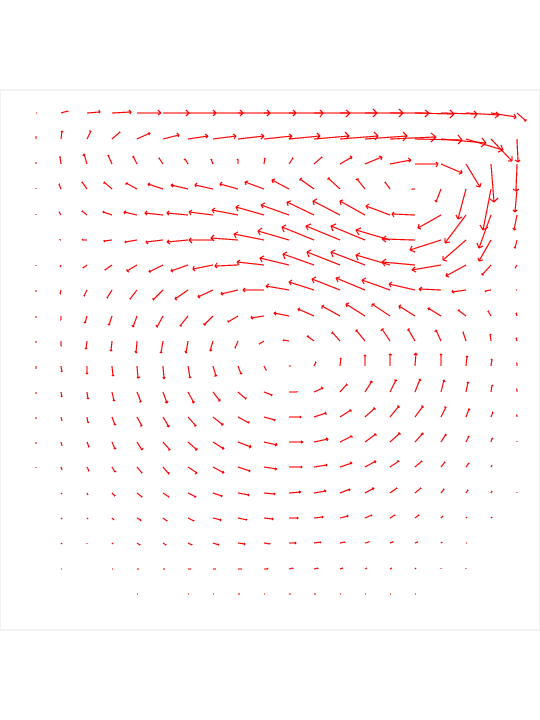
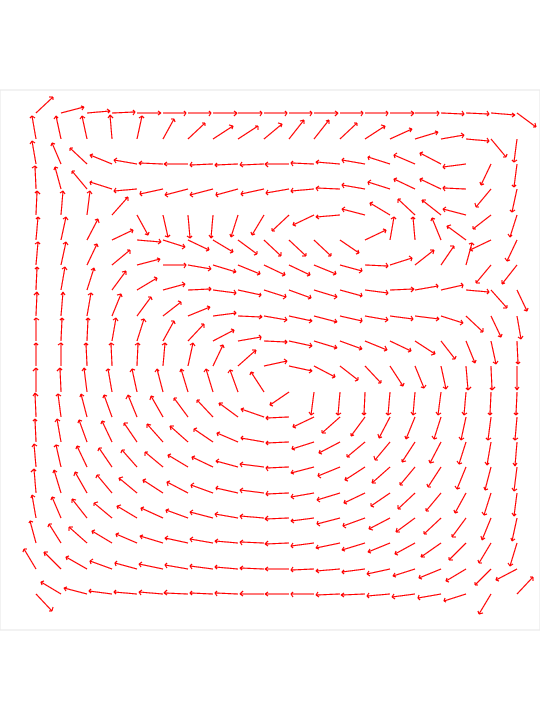
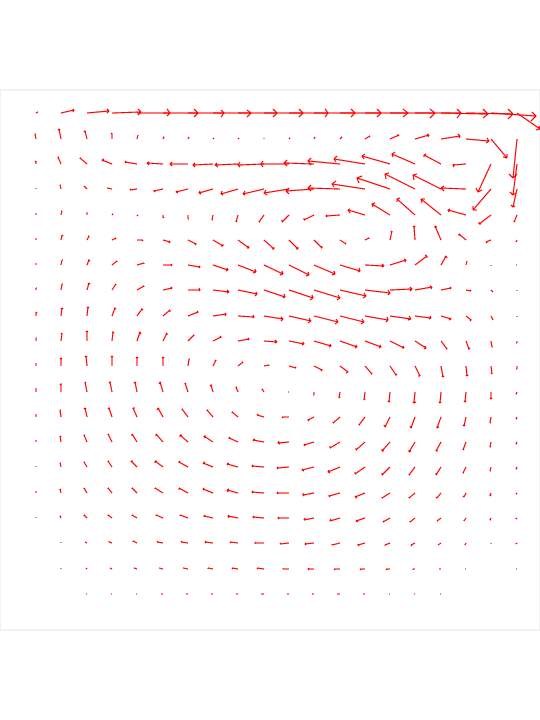
The main output of the run is the POD vectors, each in a separate file, which can be regarded as flow solutions:
Each of the POD vectors can be plotted by VECTOR_PLOT, using the xy.txt file from the CAVITY_FLOW database. I only plotted the first four:
You can go up to the POD_BASIS_FLOW page.