
plotgrid
Plots a sparse grid.Syntax
plotgrid(N,D)plotgrid(N,D,OPTIONS)H = plotgrid(...)
Description
plotgrid(N,D) Plots the sparse grid of level N and dimension D. By default, the Clenshaw-Curtis sparse grid type is selected.
plotgrid(N,D,OPTIONS) Plots the sparse grid, but with the grid type as specified in OPTIONS. OPTIONS must be a structure created with the spset function.
H = PLOTGRID(...) Returns a vector of handles to the grid points (useful for changing the look of the plotted grid).
Examples
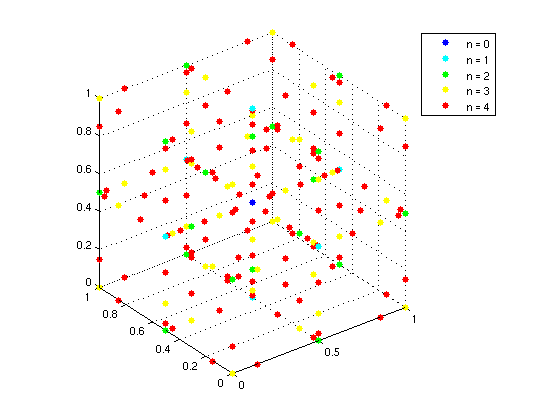
The following statements can be used to plot the Chebyshev-Gauss-Lobatto sparse grid of levelN = 4 in three dimensions, highlighting the grid points of the levels in different colors:
options = spset('GridType', 'Chebyshev');
n = 4;
h = plotgrid(n,3,options);
cols = brighten(jet(n+1),-1);
legendstr = cell(1,n+1);
for k = 0:n
  set(h(k+1), 'Color', cols(k+1,:), 'MarkerSize', 20);
  legendstr{k+1} = ['n = ' num2str(k)];
end
grid on;
legend(legendstr);
See Also
cmpgrids,
plotindices,
spgrid.