outliers_test, MATLAB programs which use the isoutlier() function, and other techniques, to identify outliers in data.
The computer code and data files described and made available on this web page are distributed under the GNU LGPL license.
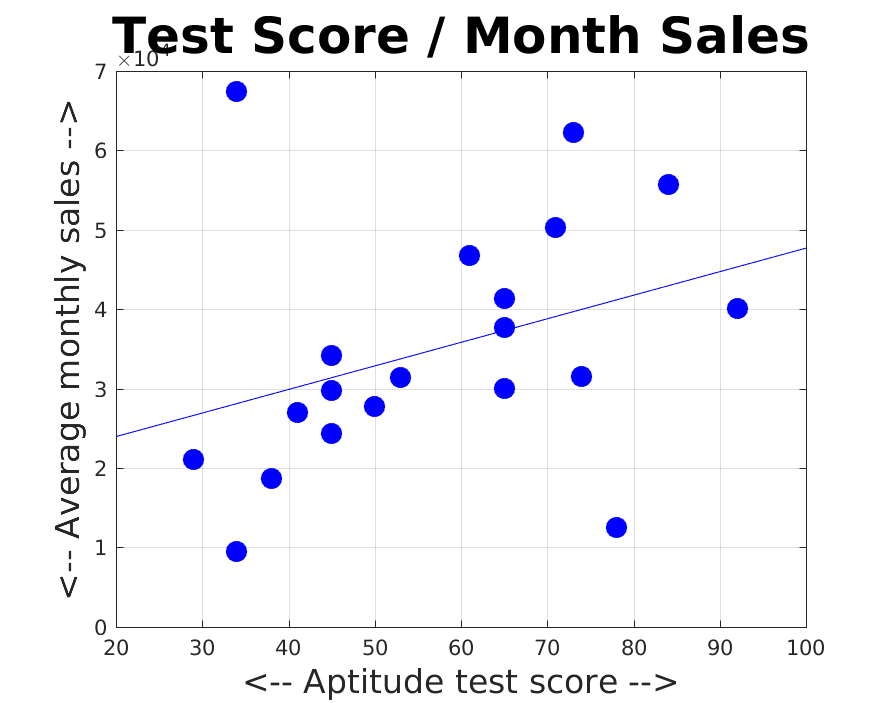
APTITUDE_TEST considers 20 employees of a business who work on commission. It compares their score on a business aptitude test with their monthly sales results. In most cases, there seems to be a strong correlation between the two quantities, there are several outliers.
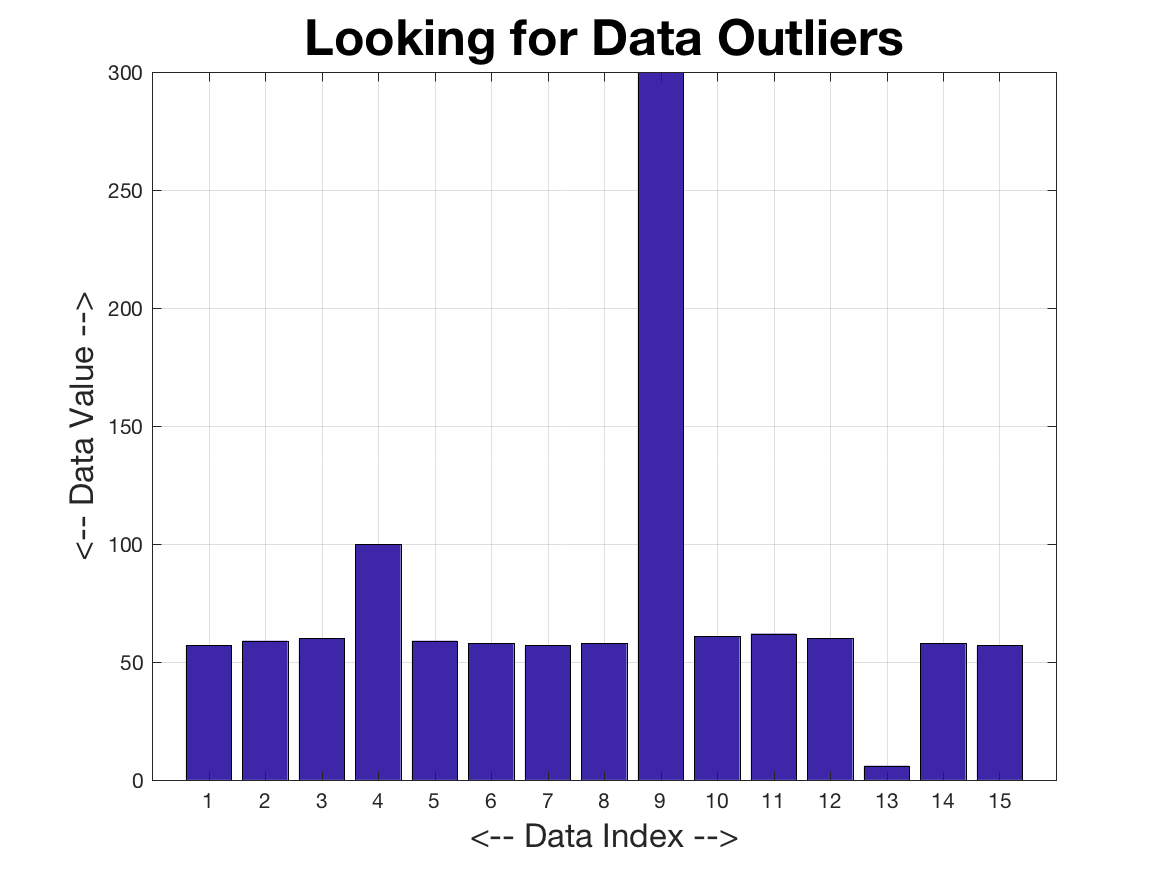
FIFTEEN considers 15 numeric values. Because this is a small sample, we can use a bar plot to display every value and spot outliers as very tall or short bars.
GLASSWARE considers a PNG gray-scale image which has some "noise" added, that is, spurious black or white pixels. This is also an example of outliers. We can "heal" the picture by replacing each pixel by the median of its 3x3 neighborhood.
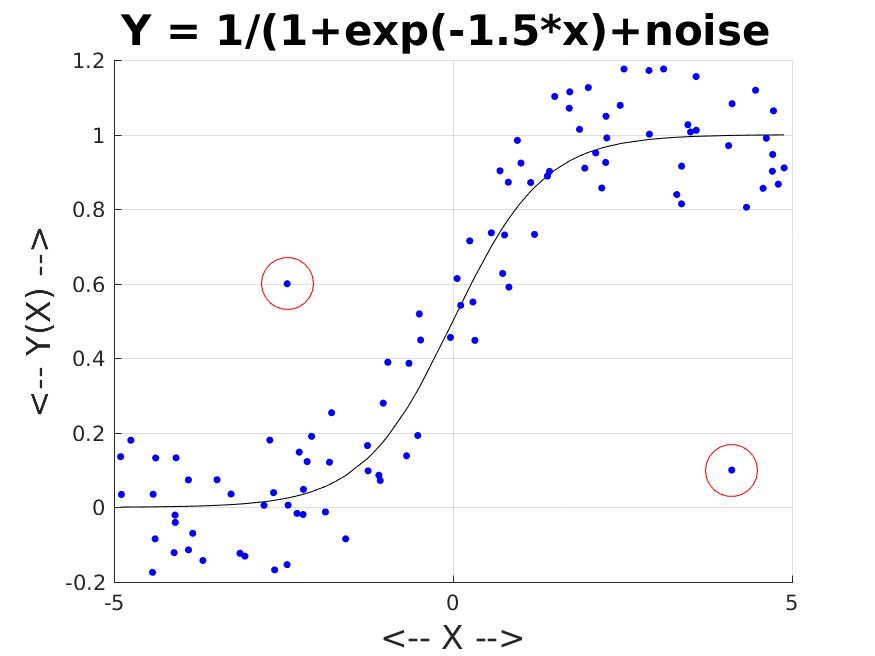
LOGISTIC plots (x,y) data that are sampled from a logistic curve, and then perturbed by a small random amount. However, a few data values have been more significantly perturbed. A simple call to isoutliers() won't detect these issues, because the outliers actually lie within the total range of the data, although they differ a lot from their local neighbors. We can detect them by using outliers() with a moving average test, which compares each Y value to the average of its nearest neighbors. data.
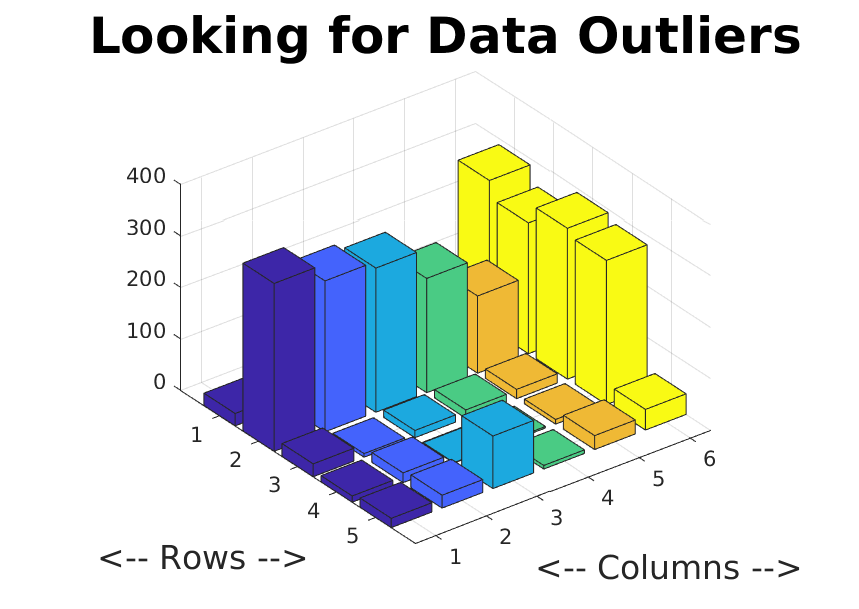
MATRIX_BAR3 considers a 5x6 array of numeric values. A 3D bar graph can be used to display the data. The isoutlier() command can be used to determine the column outliers, and by using the transpose operator, we can similarly determine the row outliers.
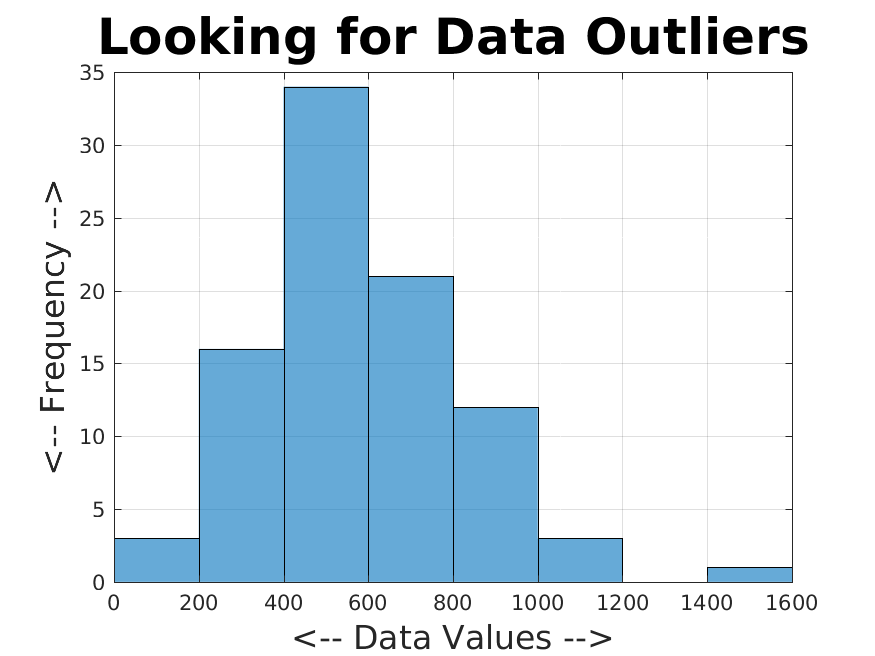
NINETY considers 90 numeric values. Instead of using a bar graph, we want to create a histogram, to see how the data spreads out across its range. We spot outliers as histogram bins of low occupancy that are far from the rest of the data.
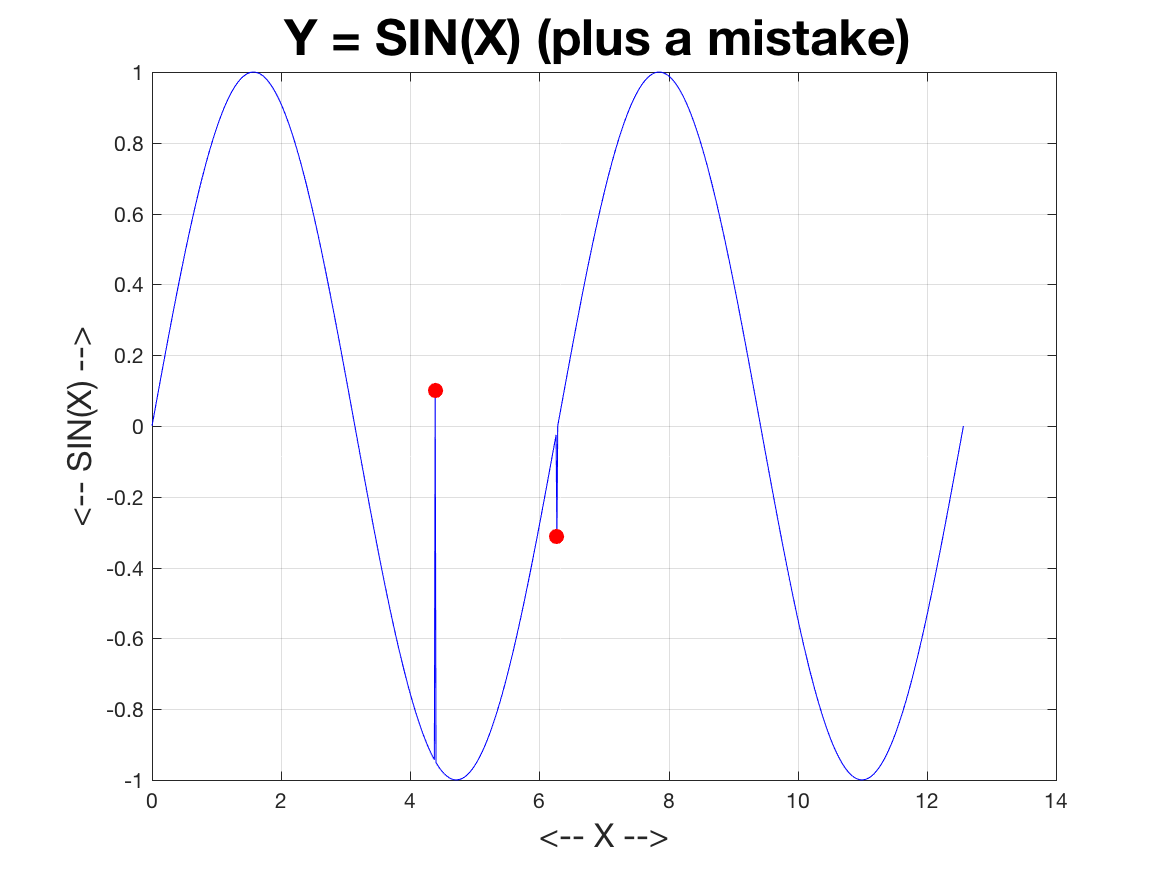
SINE_CURVE plots (x,y) data on a sine curve, except that two Y values have been noticeably (but not extremely) perturbed. A simple call to isoutliers() won't detect these issues. However, we can ask for a moving average test, which compares each Y value to the average of its nearest neighbors. This version of the test catches the bad data.
You can go up one level to the MATLAB source codes.