MATLAB_GRAPHICS is a directory of MATLAB programs which illustrate how to achieve relatively simple graphics effects that are TRIVIAL when using a pencil, SIMPLE when using any standard graphics package, but seem to be IMPOSSIBLE when struggling with MATLAB's stunningly elaborate and awkward graphics system.
I love MATLAB, I really do, but if the default behavior of MATLAB's graphic system doesn't work for you, it seems to me excruciatingly painful to discover a technique for getting what you want - moreover, there rarely seems to be a sensible logical structure to explain what is going on, nor a systematic procedure for building an image.
The computer code and data files made available on this web page are distributed under the GNU LGPL license.
AREA_UNDER_CURVE, a MATLAB function which displays the area under a curve, that is, the points (x,y) between the X axis and the curve Y=F(X).
BALL_AND_STICK_DISPLAY, a MATLAB program which demonstrates the creation of a 3D ball and stick image;
BEZIER_SURFACE_DISPLAY, a MATLAB program which displays a Bezier surface;
BOX_DISPLAY, a MATLAB program which displays a box plot, over integer pairs of data, of a function defined by two formulas.
CAVITY_FLOW_DISPLAY, a MATLAB program which displays a single velocity field solution for the driven cavity;
CC_DISPLAY, a MATLAB program which displays the points used in a 2D Clenshaw-Curtis quadrature rule;
CIRCLES, a MATLAB library which can be used, when creating graphics, to draw one or more circles, while controlling the center locations, radii, colors, edge colors, and transparency, by Chad Greene.
FD1D_DISPLAY, a MATLAB program which reads a pair of files defining a 1D finite difference model, and plots the data.
FEM_BASIS_Q4_DISPLAY, a MATLAB program which displays a finite element method (FEM) basis function associated with a linear quadrilateral (Q4) mesh.
FEM_BASIS_T3_DISPLAY, a MATLAB program which displays a finite element method (FEM) basis function associated with a 3-node triangle (T3) mesh.
FEM_BASIS_T4_DISPLAY, a MATLAB program which displays a finite element method (FEM) basis function associated with a 4-node triangle (T4) mesh.
FEM_BASIS_T6_DISPLAY, a MATLAB program which displays a finite element method (FEM) basis function associated with a 6-node triangle (T6) mesh.
FEM1D_DISPLAY, a MATLAB program which reads three files defining a 1D arbitrary degree finite element function, and displays a plot.
FEM1D_FUNCTION_10_DISPLAY, a MATLAB program which reads three files defining a 1D piecewise linear finite element function and displays a plot.
GL_DISPLAY, a MATLAB program which displays the points used in a 2D Gauss-Legendre quadrature rule;
GRAY_CODE_DISPLAY, a MATLAB program which computes the Hamming distance tables for both the binary and Gray codes, and displays 3D plots that illustrate how the Gray code does a better job of providing nearby representations for nearby numbers.
GRF_DISPLAY, a MATLAB program which reads a GRF file defining a mathematical graph and displays it in the MATLAB graphics window.
GRID_DISPLAY, a MATLAB program which reads a file of points on a grid or sparse grid, displays the grid and saves the image in a Portable Network Graphics (PNG) file;
GRIDS_DISPLAY, a MATLAB program which reads two files of grids or sparse grids, displays the first with hollow blue dots, the second with red dots.
HCELL_FLOW_DISPLAY, a MATLAB program which plots the physical data, pressures or velocities, from a run of the hcell program;
HERMITE_PRODUCT_DISPLAY, a MATLAB program which displays an image of a function created by the Cartesian product of two Hermite polynomials, such as f(x,y) = h(3,x) * h(1,y).
HISTOGRAM_DISPLAY, a MATLAB program which makes a bar plot of a set of data stored as columns in a file; the first column is the X values, and all the other columns are Y values to be shown as a stack of bars;
INOUT_FLOW_DISPLAY, a MATLAB library which displays a single velocity field solution for the inout flow;
LAGRANGE_BASIS_DISPLAY, a MATLAB library which displays the basis functions associated with a given set of nodes used with the Lagrange interpolation scheme.
MESH_DISPLAY, a MATLAB program which reads data defining a polygonal mesh and displays it, with optional numbering.
MOC_DISPLAY, a MATLAB program which estimates and displays the modulus of continuity function for a given function F(X) over a finite interval [A,B], using N sample values.
MPAS_GRID_DISPLAY, MATLAB programs which can read an MPAS netcdf grid file and display the primary polygonal mesh or the dual triangular mesh.
NESTED_SEQUENCE_DISPLAY, a MATLAB program which displays a set of nested sequences.
OBJ_DISPLAY, a MATLAB program which reads an OBJ 3D graphics file and displays it on the screen.
PLY_DISPLAY, a MATLAB program which displays an image of a 3D graphics file in PLY format;
POLYGONAL_SURFACE_DISPLAY, a MATLAB program which displays a surface in 3D described as a set of polygons;
QUAD_MESH_ORDER1_DISPLAY, a MATLAB program which plots piecewise constant data associated with a mesh of quadrilaterals;
QUAD_SURFACE_DISPLAY, a MATLAB program which plots piecewise bilinear data associated with a QUAD_SURFACE, that is, a 3D surface defined by a quadrilateral mesh;
SEQUENCE_STREAK_DISPLAY, a MATLAB program which displays a streak plot of a numeric sequence;
SHALLOW_WATER_1D_DISPLAY, a MATLAB program which can display a solution of the shallow water equations in 1D, generally as computed by the program shallow_water_1d.
SPHERE_LEBEDEV_RULE_DISPLAY, a MATLAB program which reads a file defining a Lebedev quadrature rule for the unit sphere and displays the point locations.
SPHERE_STEREOGRAPH_DISPLAY, a MATLAB library which computes and displays the results of several stereographic projections between a sphere and a plane.
SPHERE_XYZ_DISPLAY, a MATLAB program which reads XYZ information defining points in 3D, and displays a unit sphere and the points in the MATLAB 3D graphics window.
SPHERE_XYZF_DISPLAY, a MATLAB program which reads XYZF information defining points and faces, and displays a unit sphere, the points, and the faces, in the MATLAB 3D graphics window. This can be used, for instance, to display Voronoi diagrams or Delaunay triangulations on the unit sphere.
STLA_DISPLAY, a MATLAB program which reads an ASCII stereolithography (STL) file and displays it on the screen.
TCELL_FLOW_DISPLAY, a MATLAB library which displays a single velocity field solution for the T cell;
TENSOR_GRID_DISPLAY, a MATLAB program which can display the grid points of a tensor product rule used for interpolation or quadrature, in 1D, 2D or 3D.
TET_MESH_DISPLAY, a MATLAB program which reads in the node and element files defining a tet mesh and displays a wireframe image.
TETRAHEDRON_SLICE_DISPLAY, a MATLAB program which determines the intersection between a tetrahedron and a plane and displays the result.
TRI_SURFACE_DISPLAY, a MATLAB program which displays the 3D graphics information in a TRI_SURFACE file;
TRIANGLE_DISPLAY, a MATLAB program which displays the nodes and elements of a triangulation on the MATLAB graphics screen, assuming the data has been stored in NODE and ELE files by the TRIANGLE program.
TRIANGULATION_DISPLAY, a MATLAB program which displays the nodes and elements of a triangulation on the MATLAB graphics screen;
TRIANGULATION_ORDER1_DISPLAY, a MATLAB program which plots piecewise constant data associated with a triangulation;
VORONOI_DISPLAY, a MATLAB program which computes the exact Voronoi diagram using geompack, and displays it.
XY_DISPLAY, a MATLAB program which reads XY information defining points in 2D, and displays an image in a MATLAB graphics window;
XYF_DISPLAY, a MATLAB program which reads XYF information defining points and faces in 2D, and displays an image in a MATLAB graphics window.
XYL_DISPLAY, a MATLAB program which reads XYL information defining points and lines in 2D, and displays an image in a MATLAB graphics window.
XYZ_DISPLAY, a MATLAB program which reads XYZ information defining points in 3D, and displays an image in the MATLAB graphics window.
XYZF_DISPLAY, a MATLAB program which reads XYZF information defining points and faces in 3D, and displays an image using OpenGL.
XYZL_DISPLAY, a MATLAB program which reads XYZL information defining points and lines in 3D, and displays an image in a MATLAB graphics window.
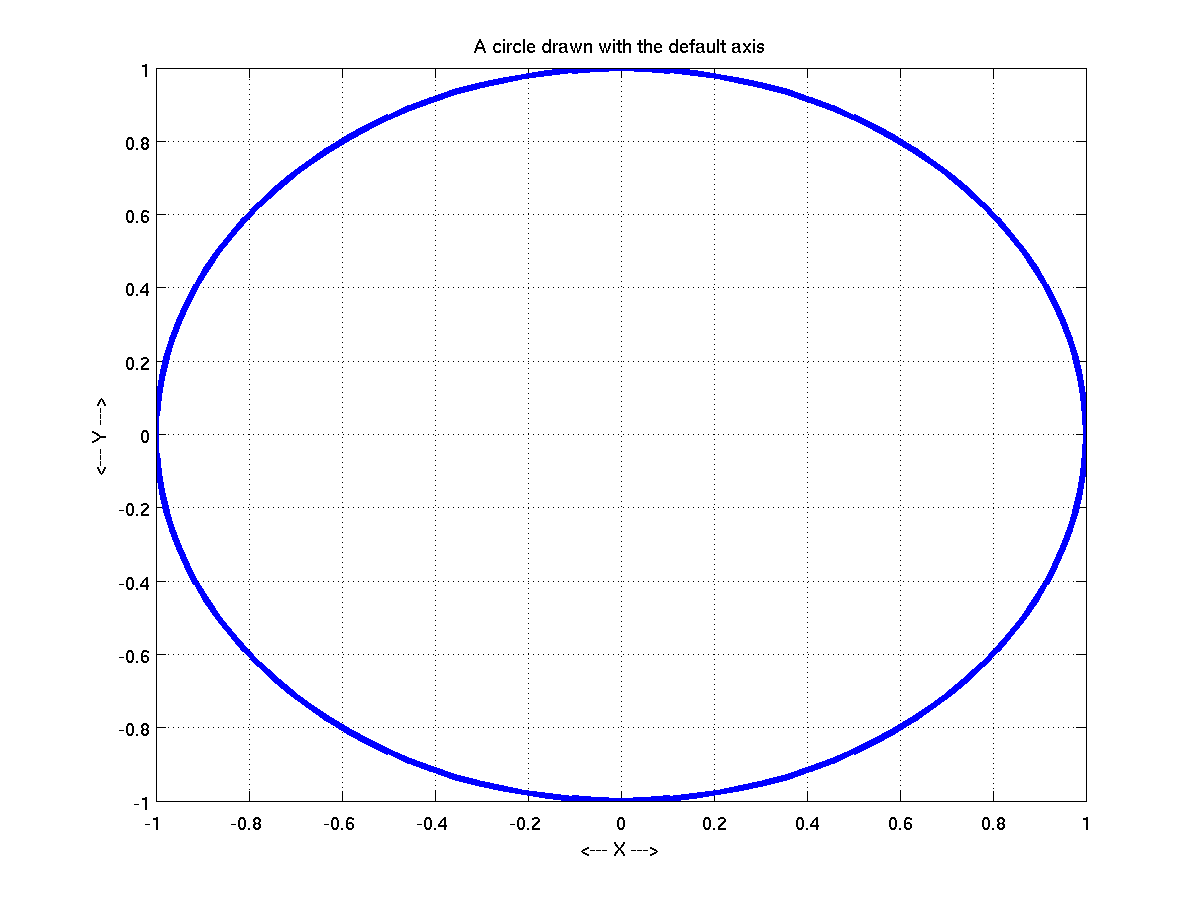
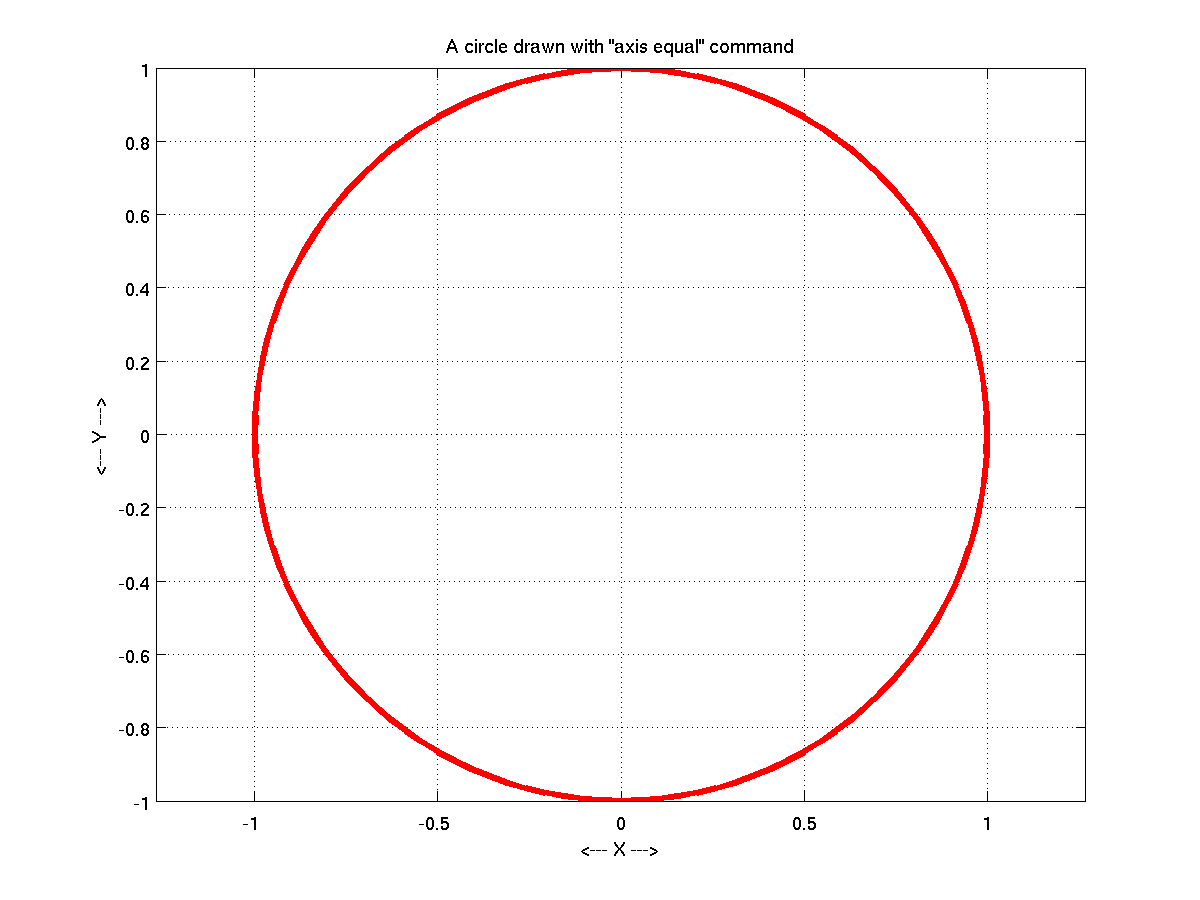
You plot a circle, and it comes out an ellipse. What is going on? Briefly, MATLAB uses a rectangle to display your plot. It takes the X and Y ranges of your data, and stretches them along the horizontal and vertical directions of the rectangle. This guarantees that a plot that is logically square will be displayed as a rectangle, and thus a circle becomes an ellipse. Luckily, the "axis equal" command helps. MATLAB still plots inside a rectangle, but now it stretches your X and Y data by the same single scale factor, resulting in some new white space to the left and right of your plot of a perfect circle.
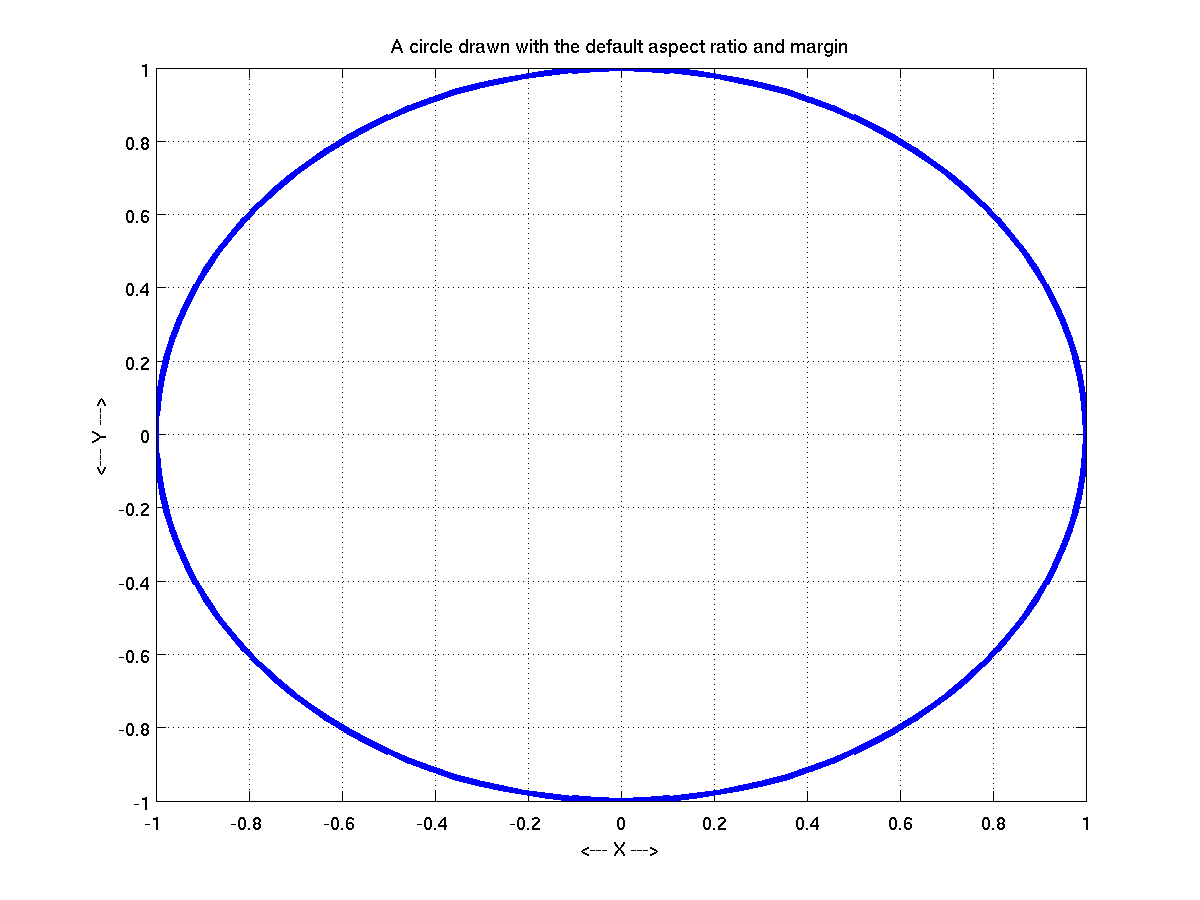
Surprisingly, a typical MATLAB plot can involve a lot of empty space. In the simple case where you are plotting a circle, you will get white space in the grid region itself if you enforce equal axis units, since MATLAB wants to display the grid within a rectangle. But you will also get a substantial margin of white space around the plot area itself. This can be annoying when you are trying to prepare graphics for use in a publication, or if you want to put several images side by side - the white space, which contains no information, eats up lots of space.
Can you cut back that white space? In particular, if you want to plot a circle (or anything else whose shape doesn't correspond to MATLAB's "golden rectangle"), can you make an image that is mathematically correct, and economic in terms of wasted white space?
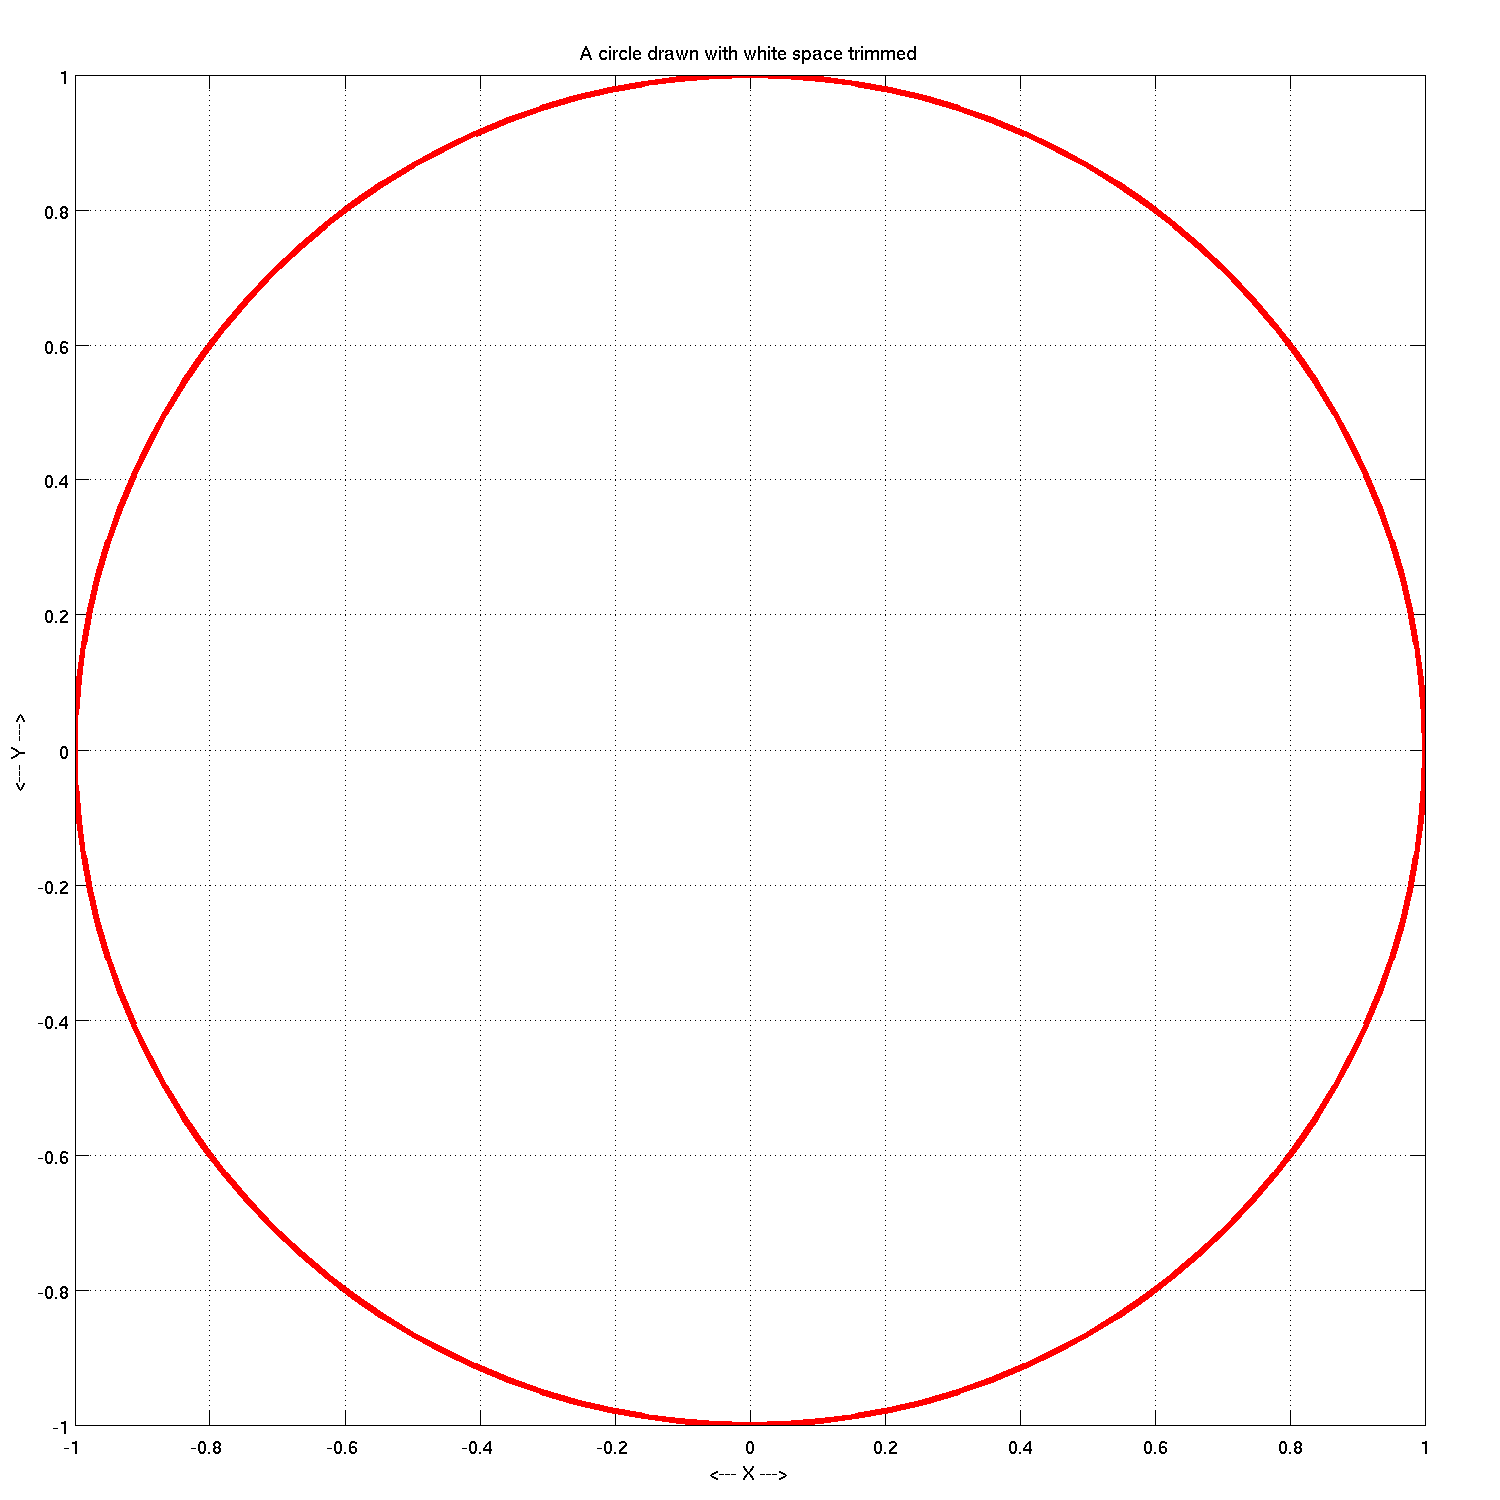
You may try various combinations of "axis equal", "axis square", "axis tight", "axis ( [0,1,0,1] )" and so on, all the time coming halfway to your goal, without ever actually achieving an image that is square (or whatever aspect ratio you want), doesn't have wasted graph space, and doesn't have that excessive margin around the plot.
After wasting a lot of time, I stumbled across a few commands that, used together, seem to achieve the correct result. However, in my case, the image still looks rectangular in the MATLAB interactive viewer - but comes out nice and square in the PNG image rendered by the PRINT command.
You can go up one level to the MATLAB source codes.