grid_display_test, a MATLAB program which calls grid_display() to read an ASCII file defining a set of points on a 1D, 2D or 3D grid or sparse grid, and display a plot of those points, inside a plot frame of user-specified range [Rmin,Rmax].
The computer code and data files described and made available on this web page are distributed under the GNU LGPL license.
grid_display, a MATLAB program which reads a file of points on a grid or sparse grid, displays the grid and saves the image in a Portable Network graphics (PNG) file;
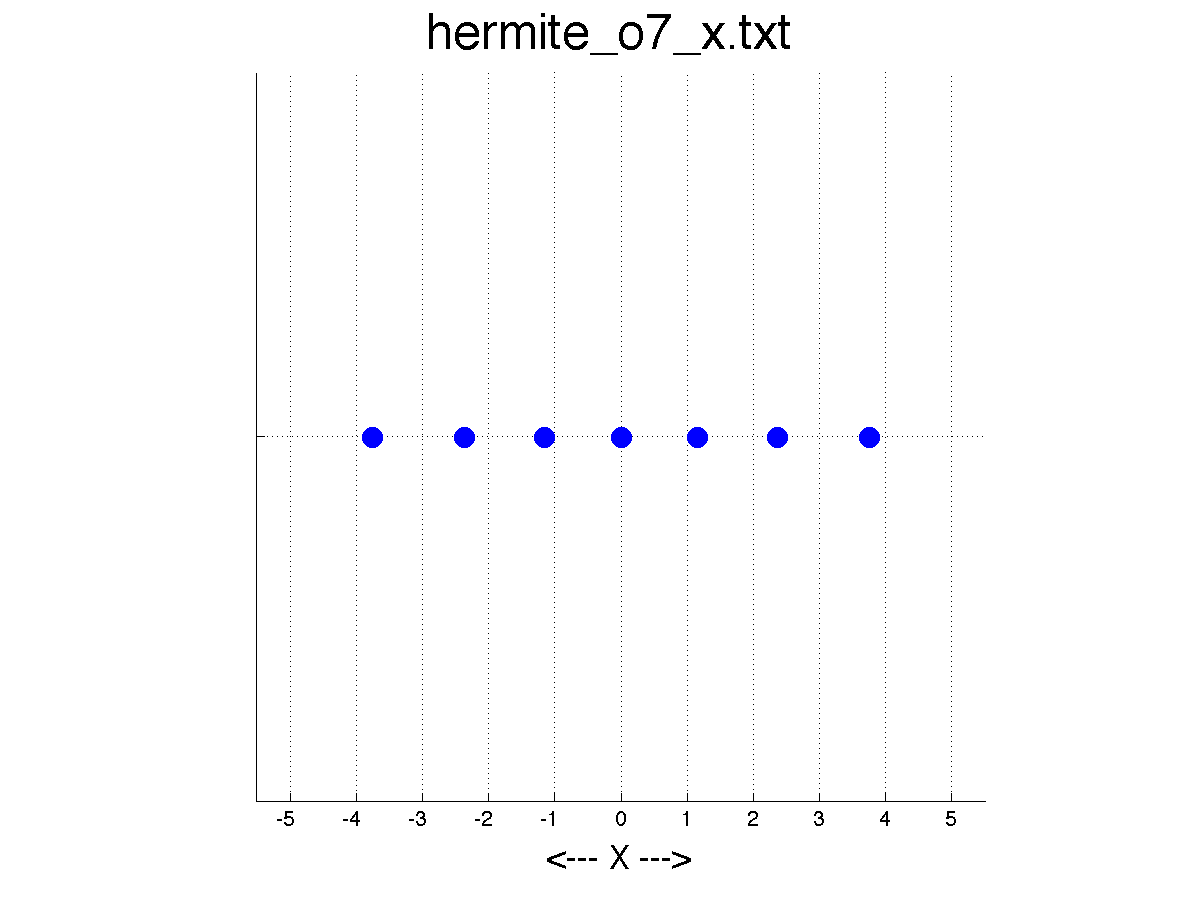
A 1D example:
grid_display ( 'hermite_o7_x.txt', -5, +5 )
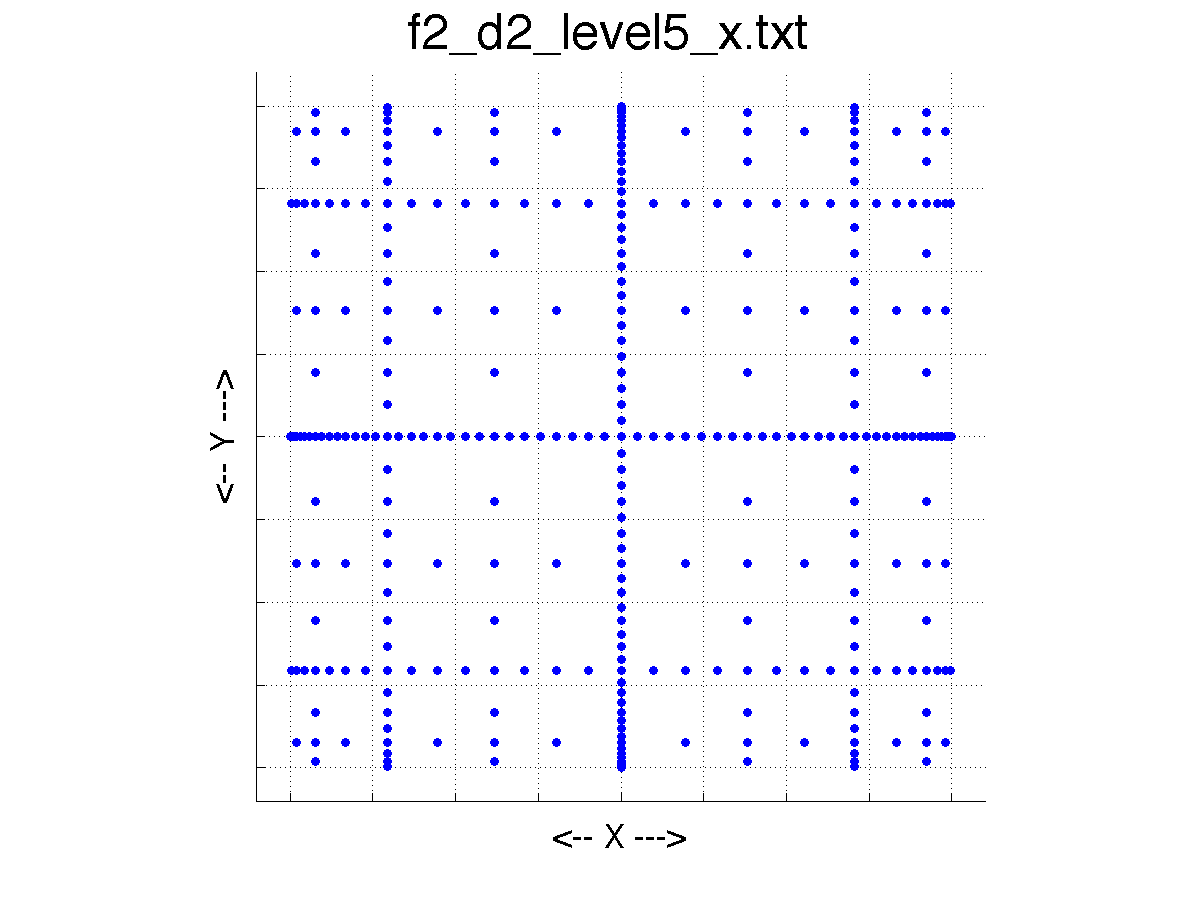
A 2D example:
grid_display ( 'f2_d2_level5_x.txt', -1, +1 )
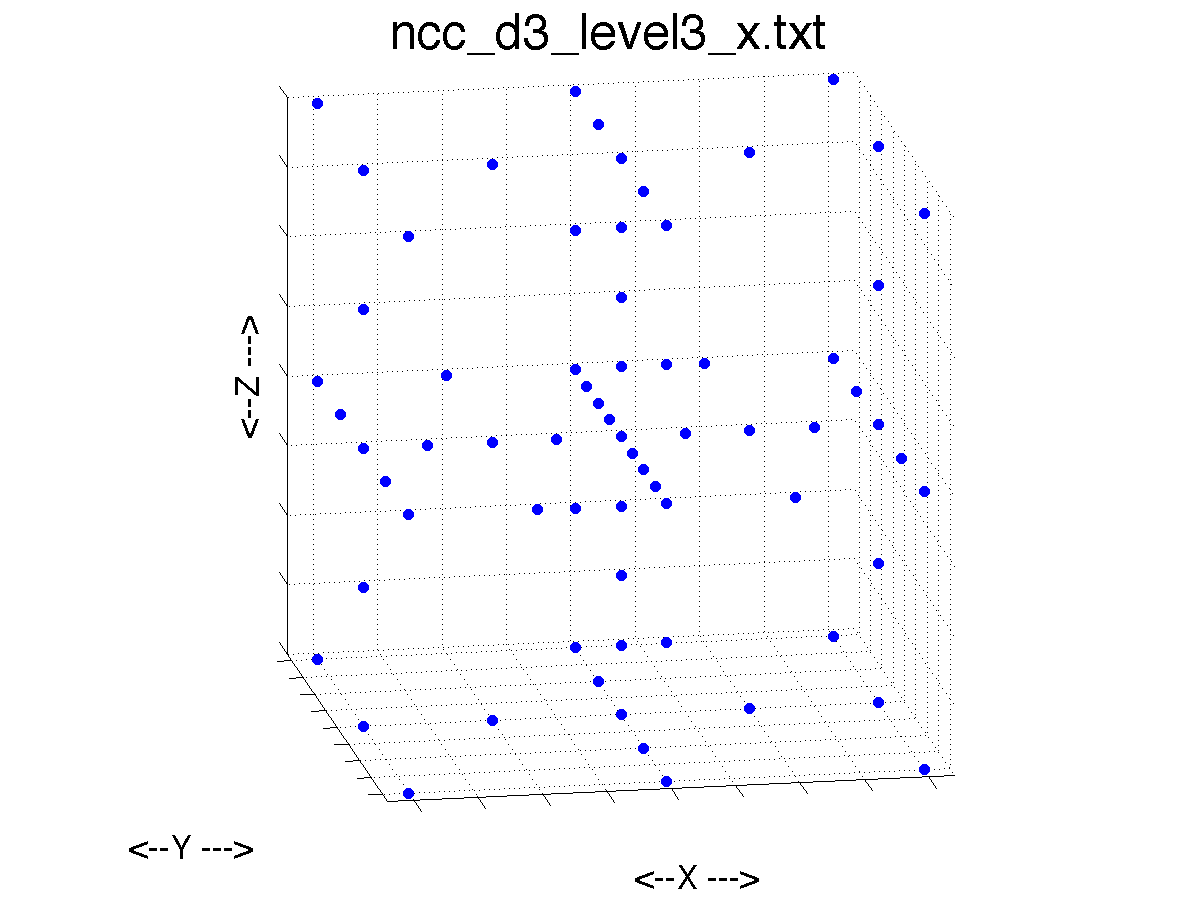
A 3D example of a sparse grid using Newton Cotes Closed points,
grid_display ( 'ncc_d3_level3_x.txt', 0, +1 )
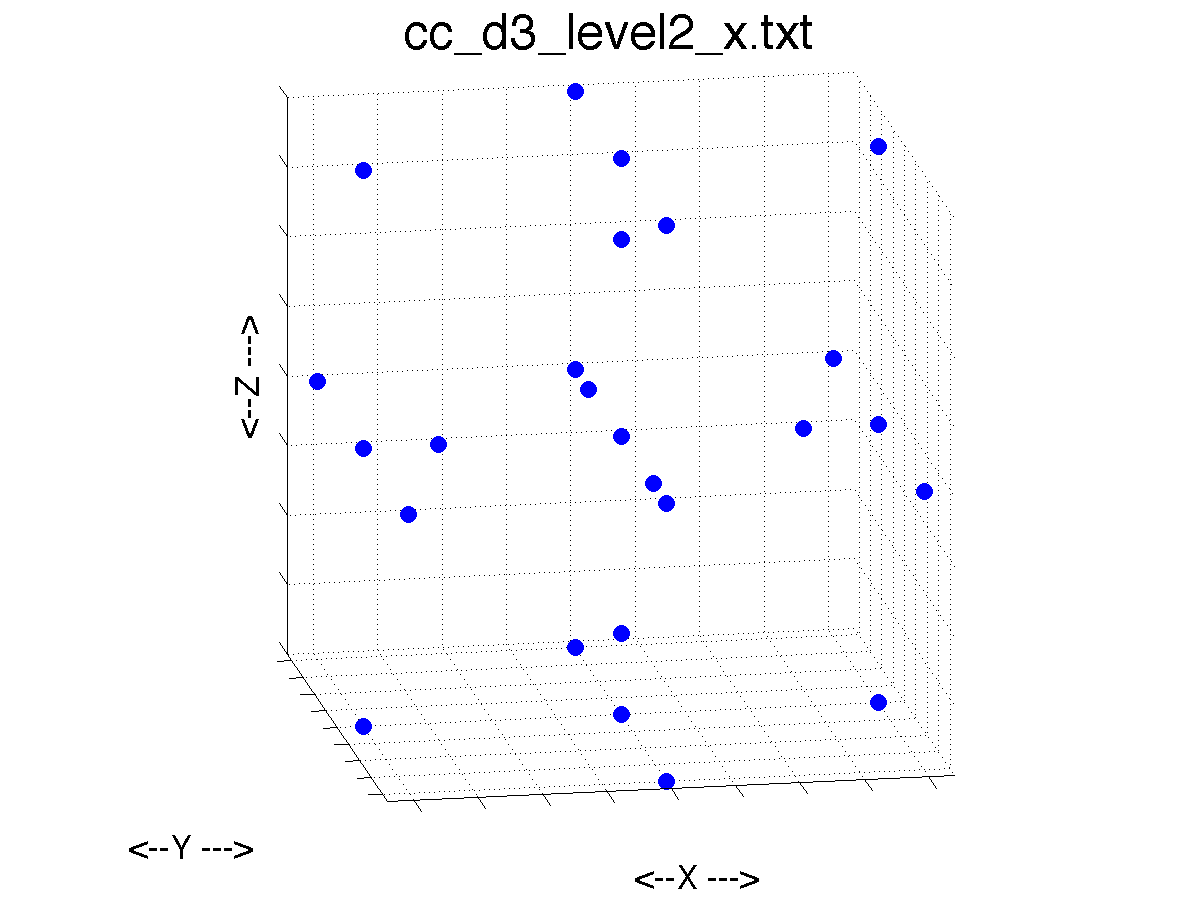
A 3D example of a sparse grid using Clenshaw Curtis points:
grid_display ( 'cc_d3_level2_x.txt', -1, +1 )