gpl_display_test, a MATLAB program which calls gpl_display() to read the data in a typical gnuplot GPL file, describing a 1D, 2D or 3D curve, or a surface Z(X,Y) defined on a regular grid, a triangular grid, or an irregular quadrilateral grid, display it in a more attractive way than gnuplot is capable of.
The computer code and data files made available on this web page are distributed under the GNU LGPL license.
gpl_display, a MATLAB library which tries to read the data in a typical gnuplot GPL file, describing a 1D, 2D or 3D curve, or a surface Z(X,Y) defined on a regular grid, a triangular grid, or an irregular quadrilateral grid, displays it in a more attractive way than gnuplot is capable of.
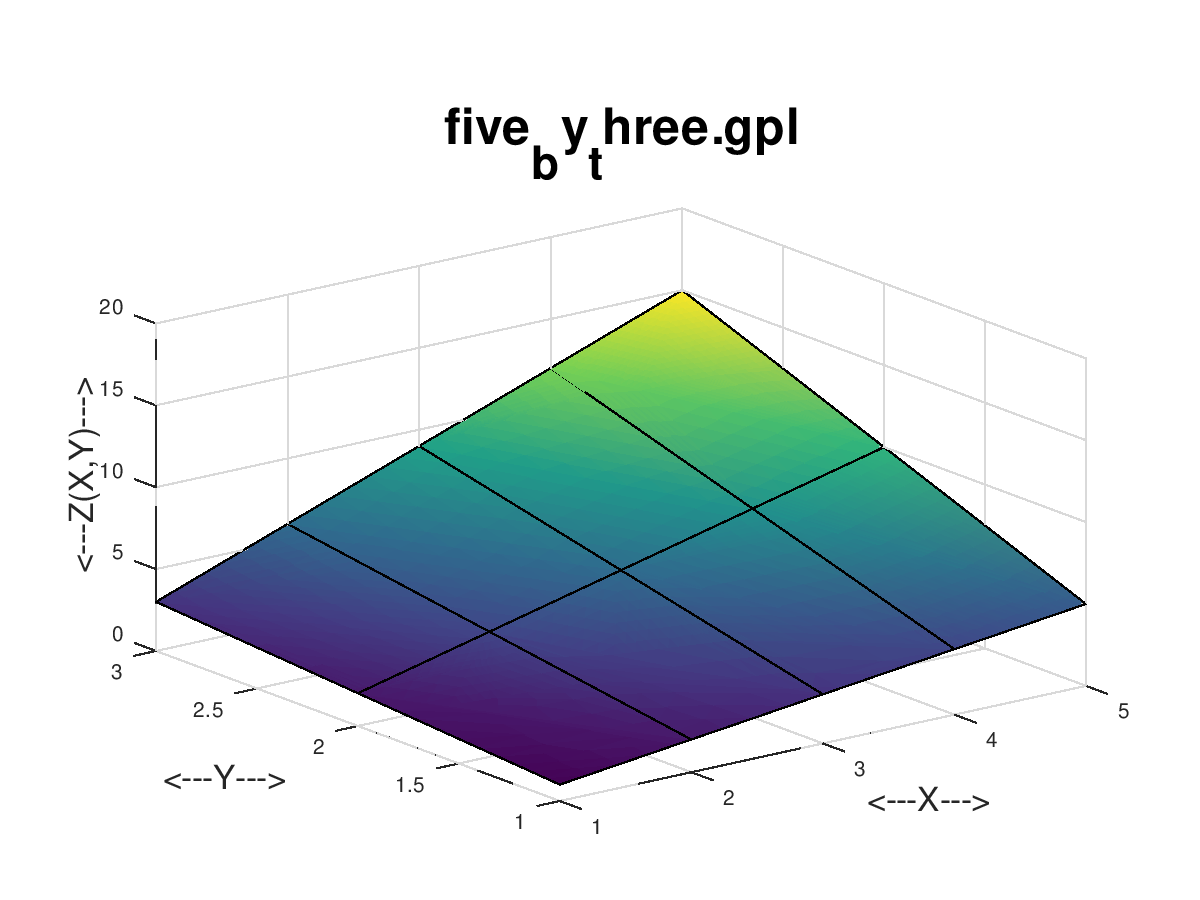
five_by_three is a set of (X,Y,Z(X,Y)) data on a rectangular grid of 5 X by 3 Y values. The GPL file stores this as 3 sets of data, separated by blank lines. Gnuplot can display this data as a 3D surface using the command "splot '5by3.gpl' using lines". However, MATLAB can make a nice 3D surface using surf();
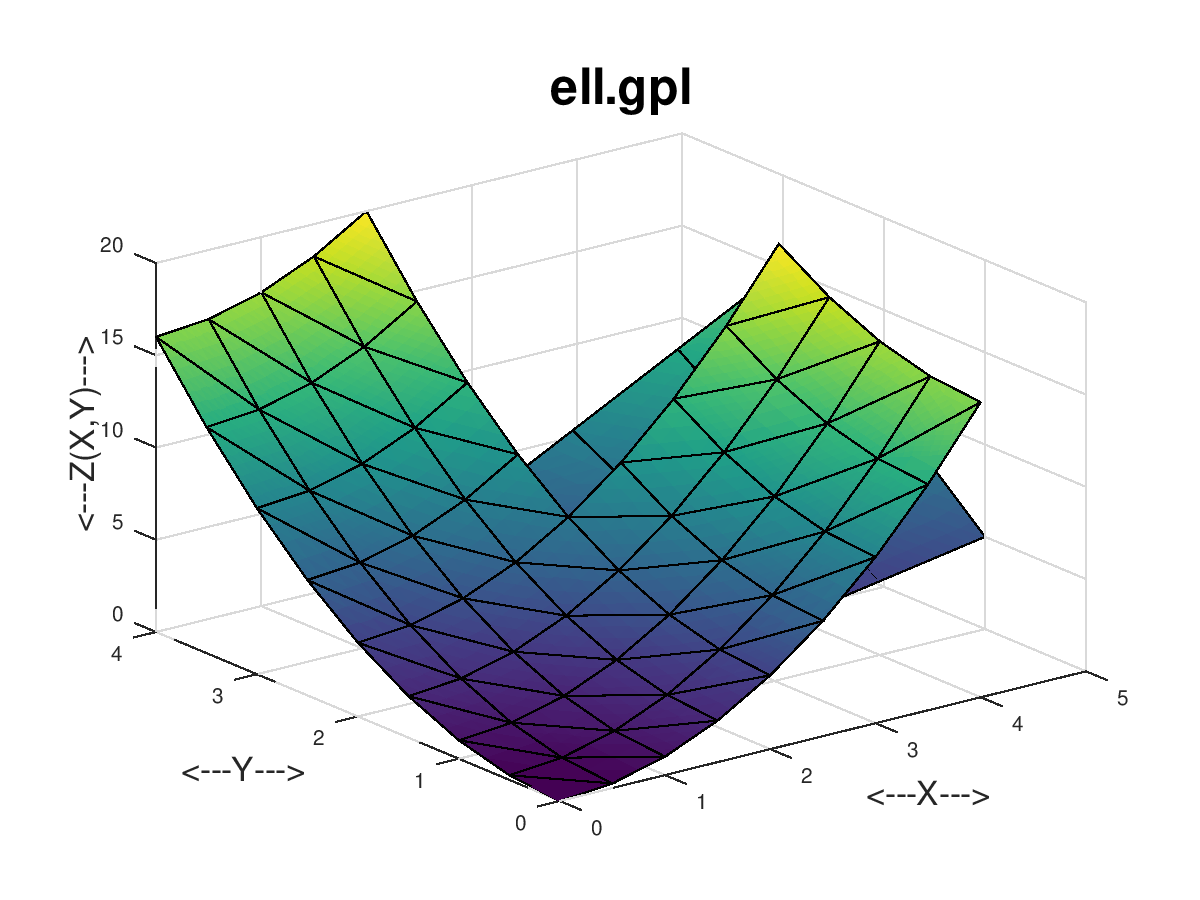
ell is a set of (X,Y,Z(X,Y)) data on a grid of triangles. The GPL file stores this as many sets of 4 lines of data, separated by two blank lines. Each set of 4 lines lists the X, Y and Z values for one vertex of a triangle, with the first line repeated as the fourth line. Gnuplot can display this data as a 3D surface using the command "splot 'ell.gpl' using lines". However, MATLAB can make a nice 3D surface using patch();
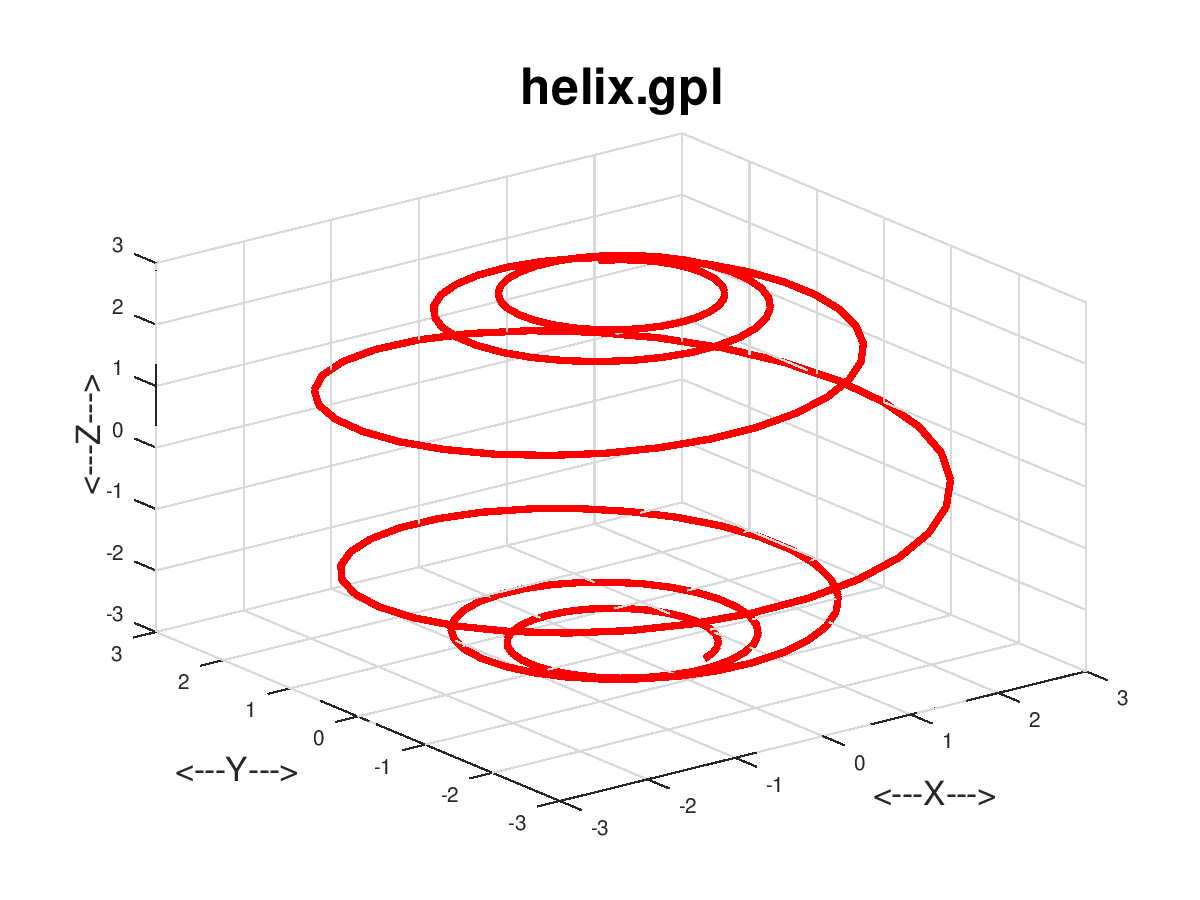
helix is a set of (X,Y,Z) data that defines a helix. The GPL file stores this as 201 triples of X, Y, Z values. Gnuplot can display this data using the command "splot 'helix.gpl' using lines". MATLAB can also make a nice curve with the plot3() command.
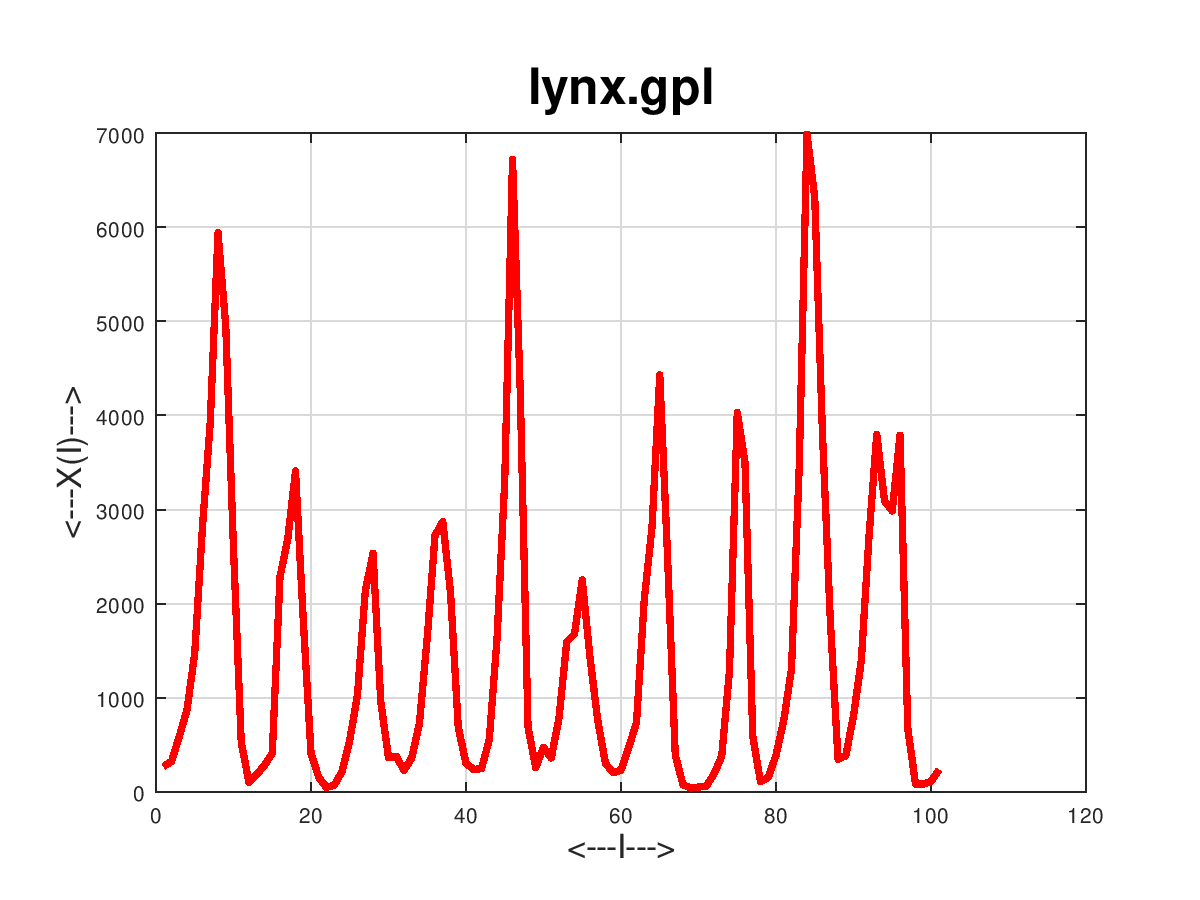
lynx is a set of X data, tabulating the lynx "harvest". The GPL file stores this as 114 sets of X values. Gnuplot can display this data using the command "plot 'lynx.gpl' using lines". MATLAB can also make a nice curve with the plot() command.
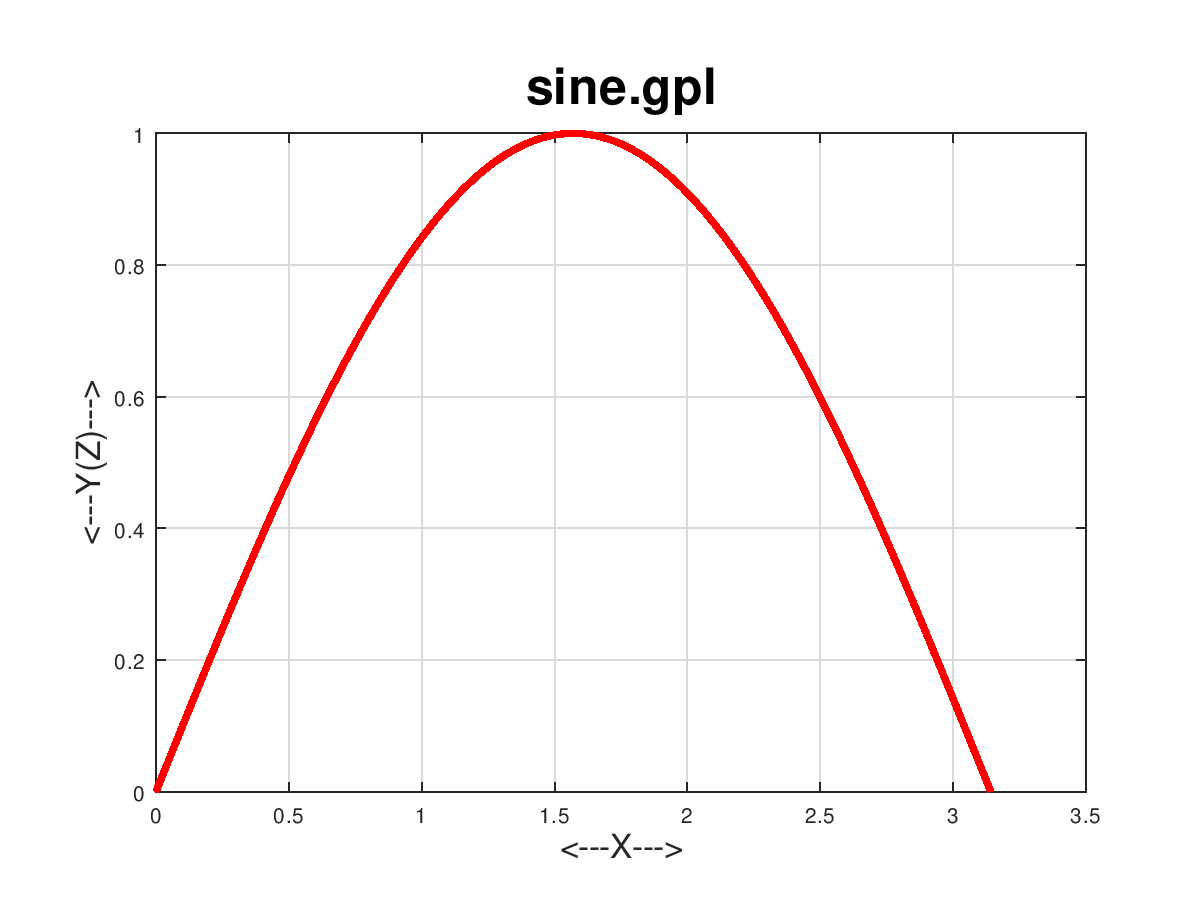
sine is a set of (X,Y(X)) data over [0,pi], tabulating the sine function. The GPL file stores this as 101 pairs of X, Y values. Gnuplot can display this data using the command "plot 'sine.gpl' using lines". MATLAB can also make a nice curve with the plot() command.
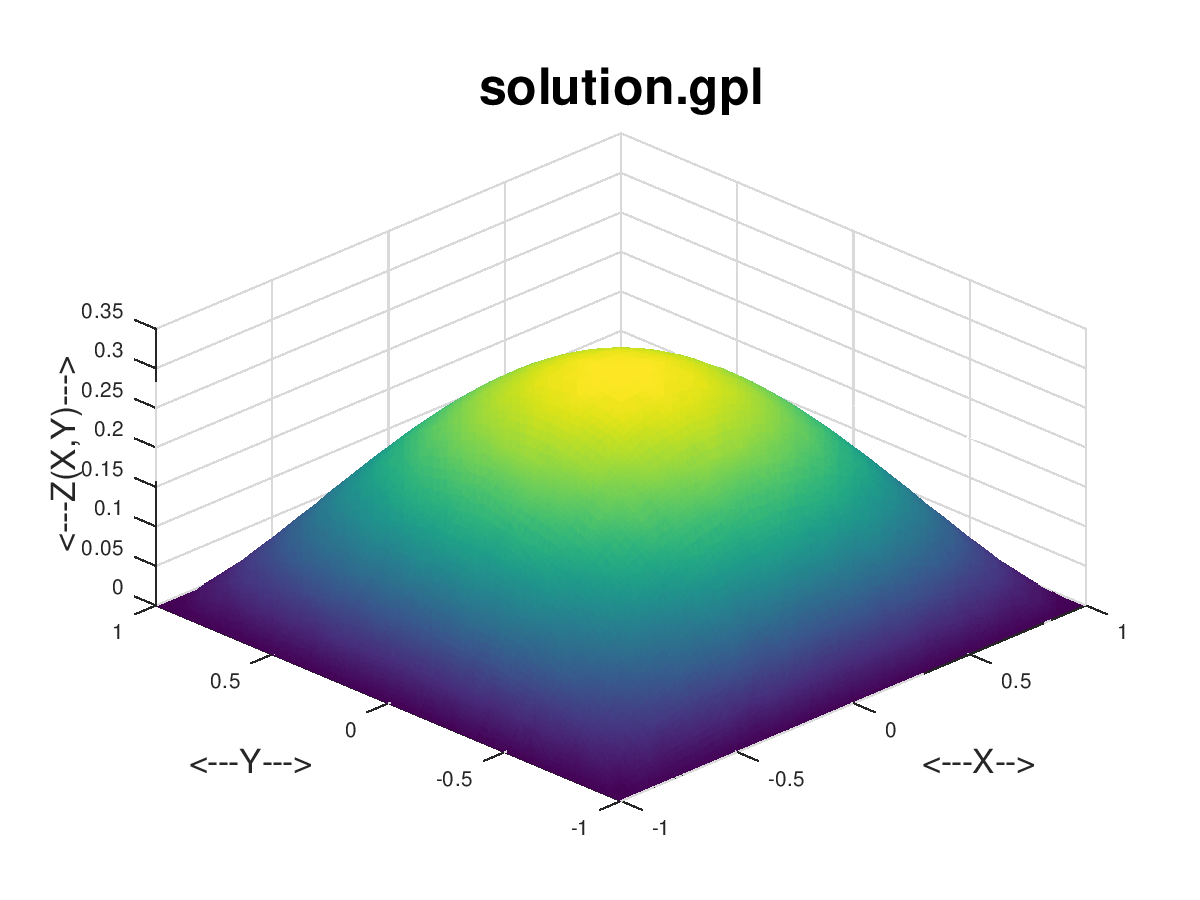
solution is a set of (X,Y,Z(X)) data over the unit square, representing a solution to the Poisson equation as computed by the deal.ii program. In 2D, the deal.ii program uses a mesh of rectangular elements, which need not be of the same size. Therefore, the solution is not stored as a regular grid, but rather as a collection of values on little rectangular patches. The GPL file stores this as 1024 such patches. Each patch is recorded as the X,Y,Z values at nodes A and B, followed by one blank line, and then the X,Y,Z values at nodes C and D, followed by two blank lines. The rectangle can be traced by connecting A, B, D and C (in that order). Gnuplot can display this data using the command "splot 'solution.gpl' using lines". MATLAB can also make a nice surface with the patch() command.