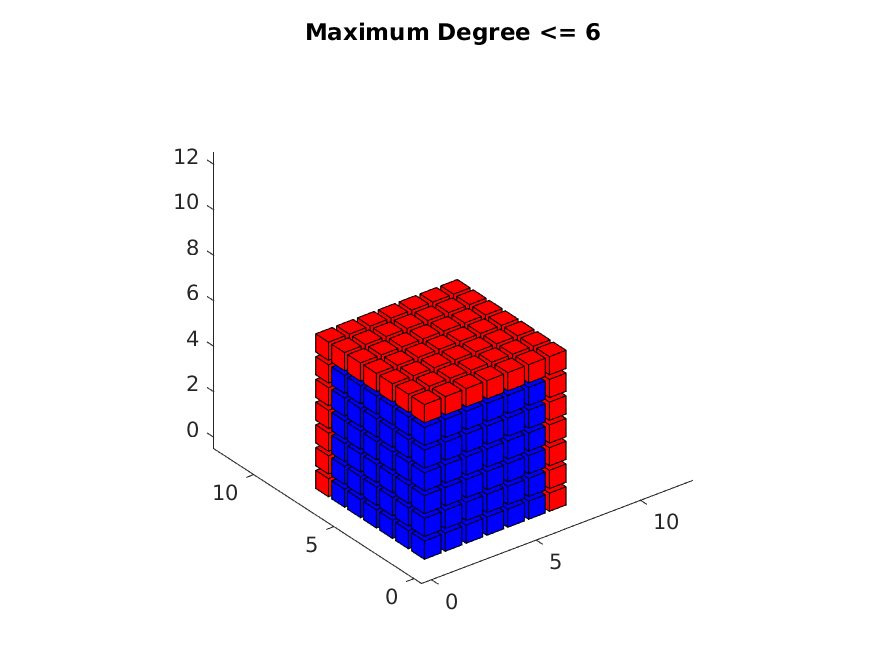
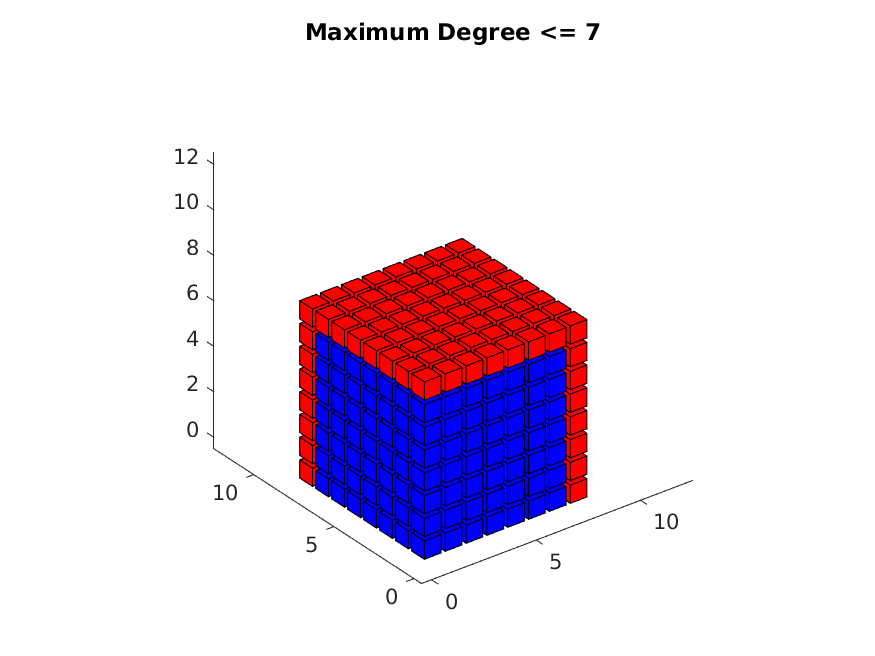
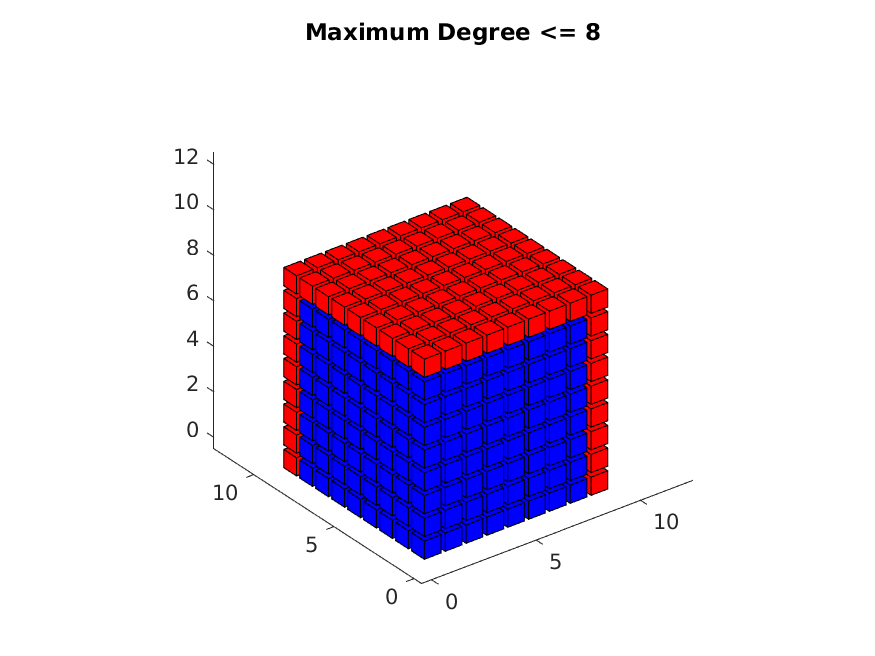
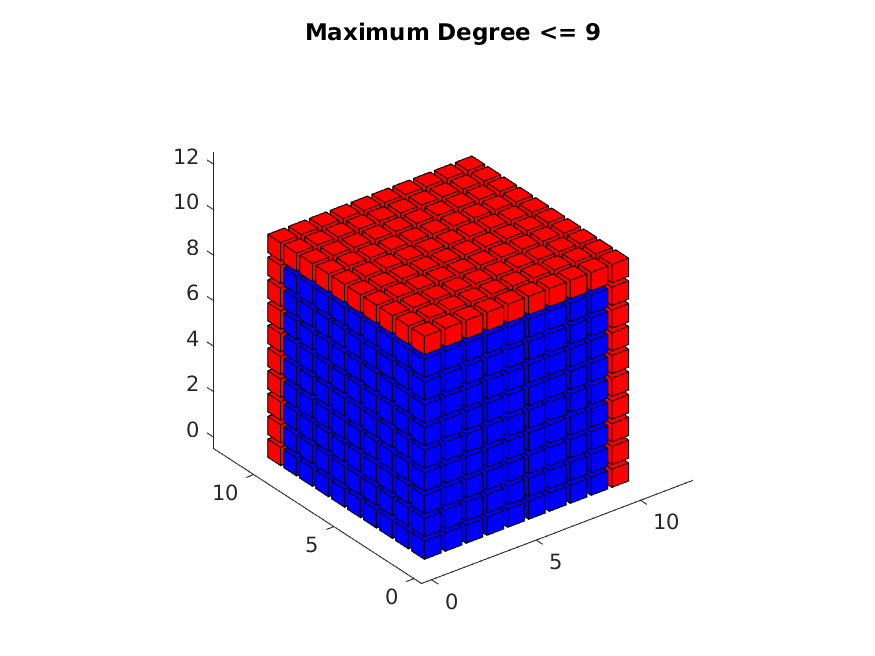
CUBE_DISPLAY is a MATLAB program which creates a plot over a range of integer cubes, which can be painted red (new stuff) and or blue (old stuff).
The computer code and data files made available on this web page are distributed under the GNU LGPL license.
cube_display, a MATLAB program which displays a cube plot, over integer triples of data, of a function defined by two formulas.
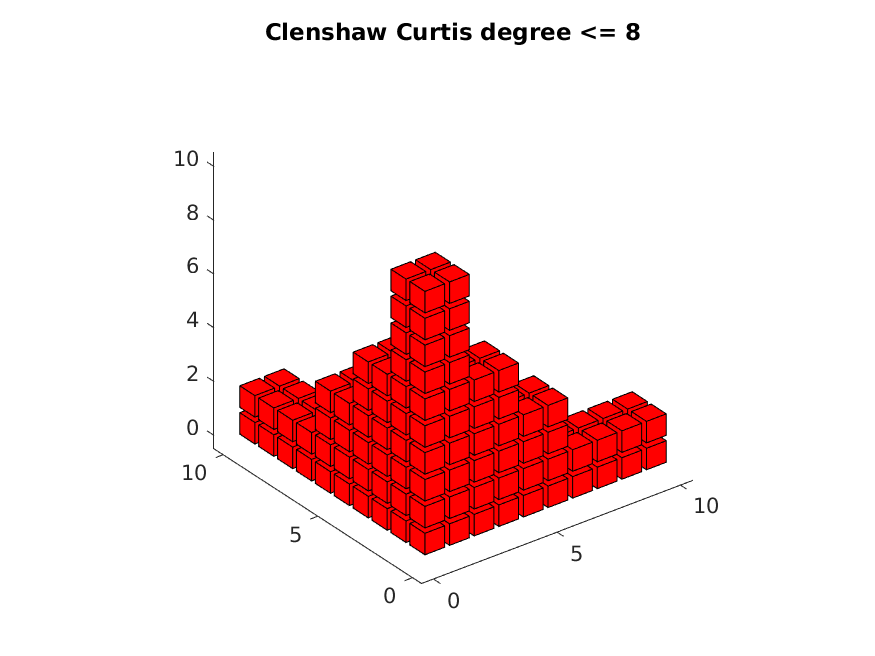
The CC functions are just a quick fix to allow me to define the degrees of 3D Clenshaw-Curtis sparse grids.
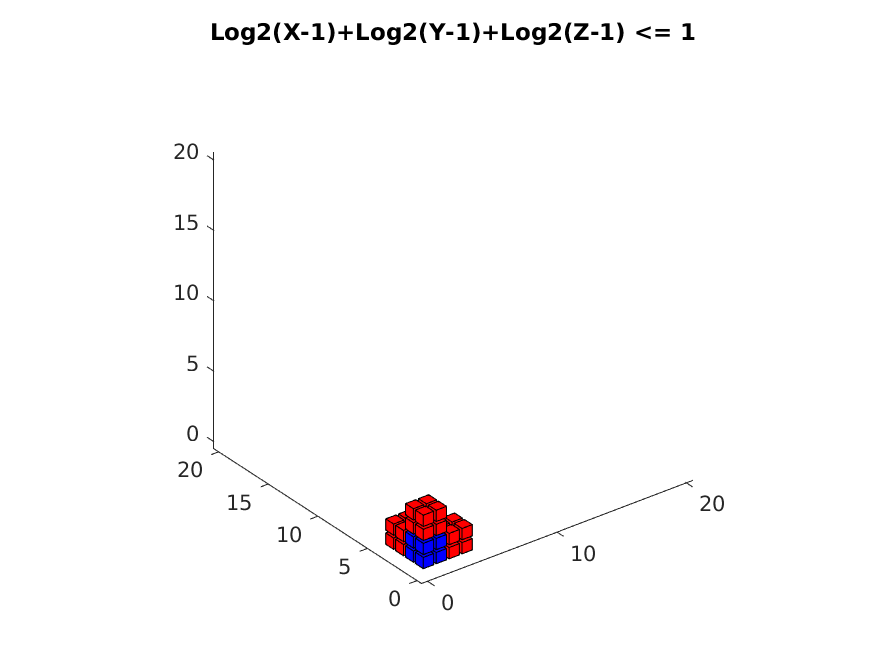
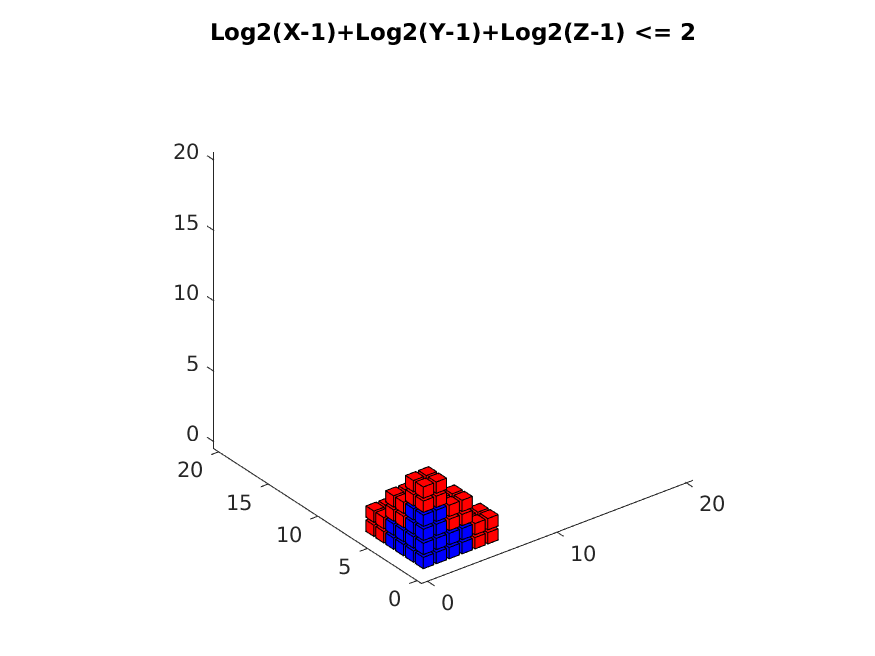
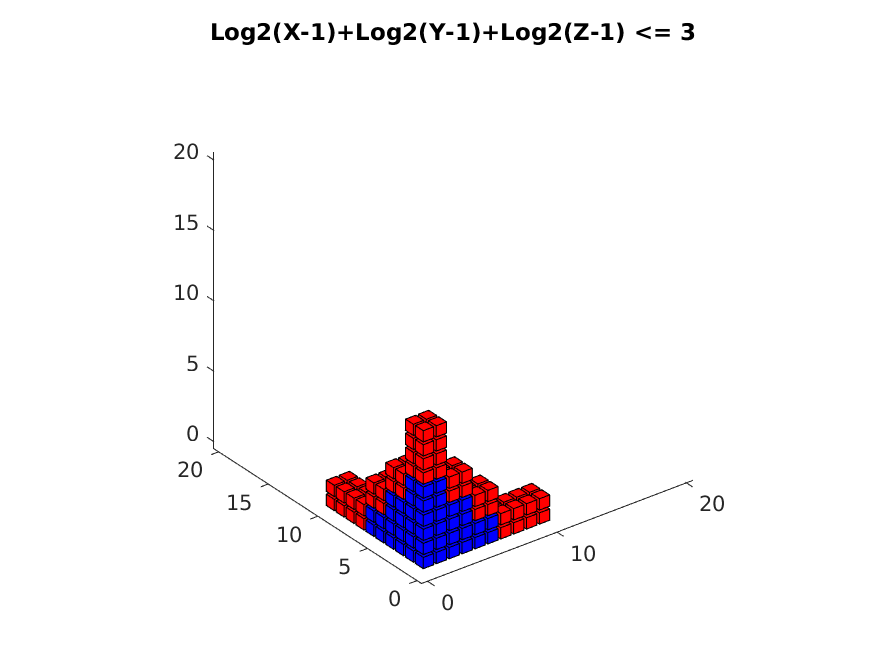
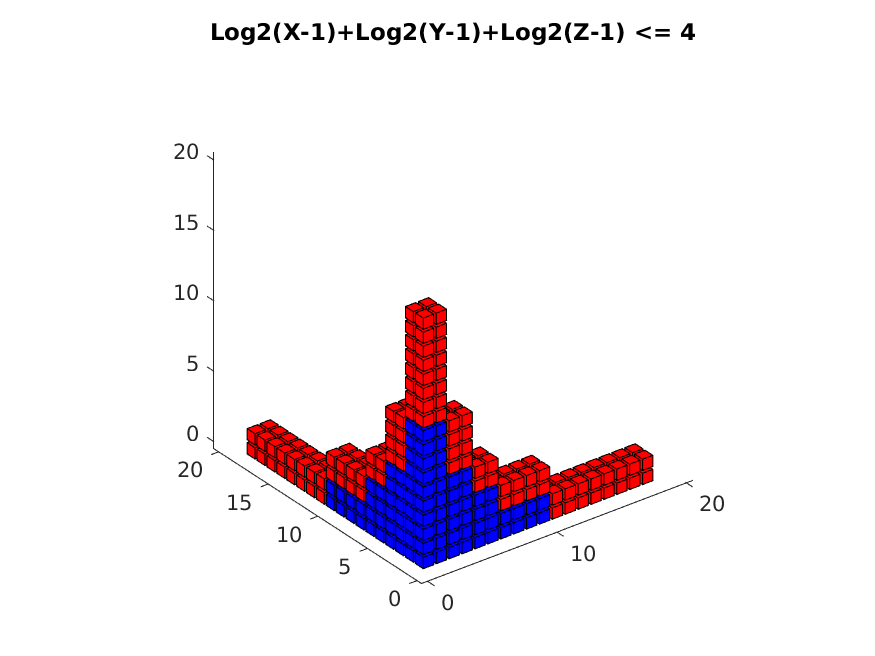
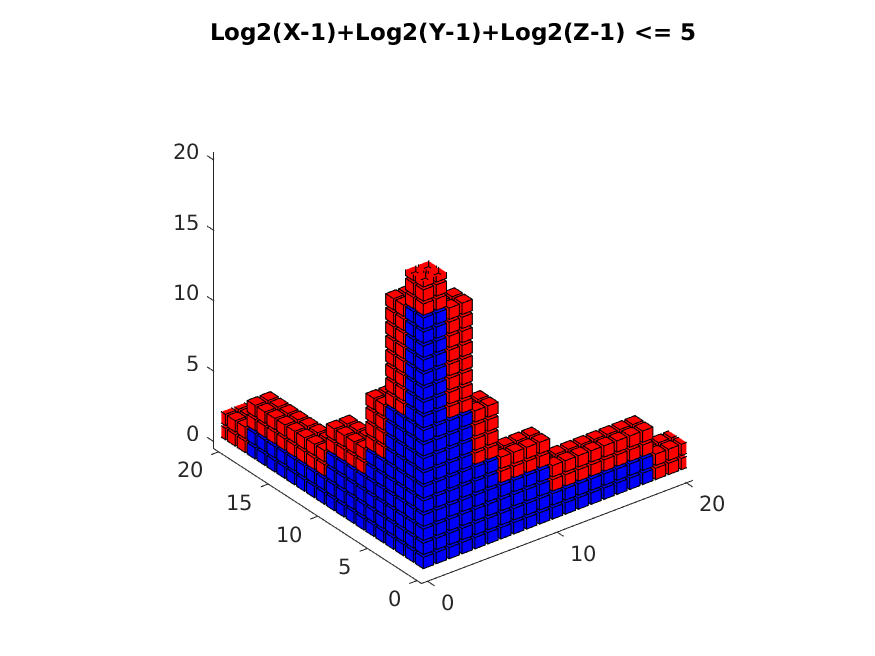
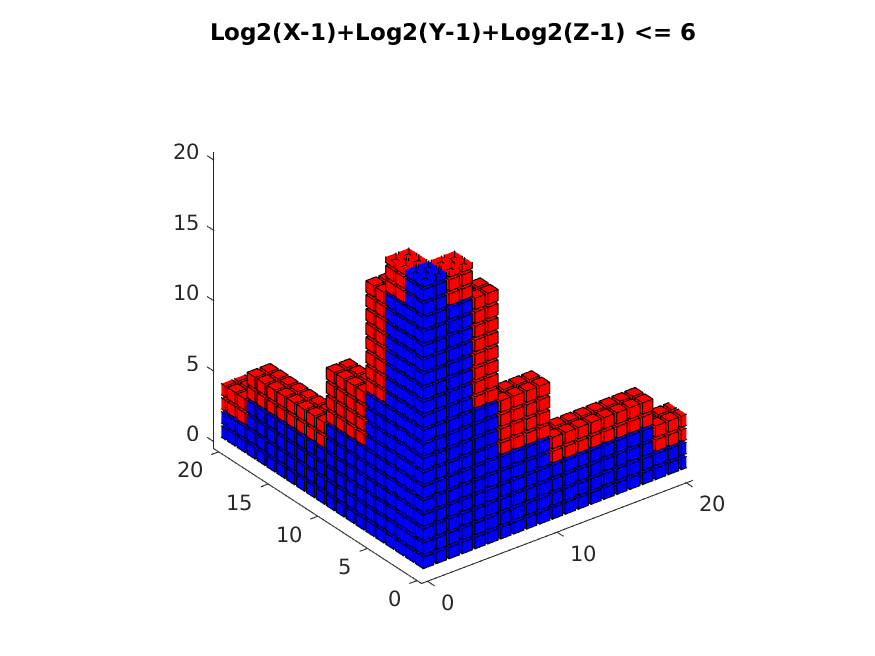
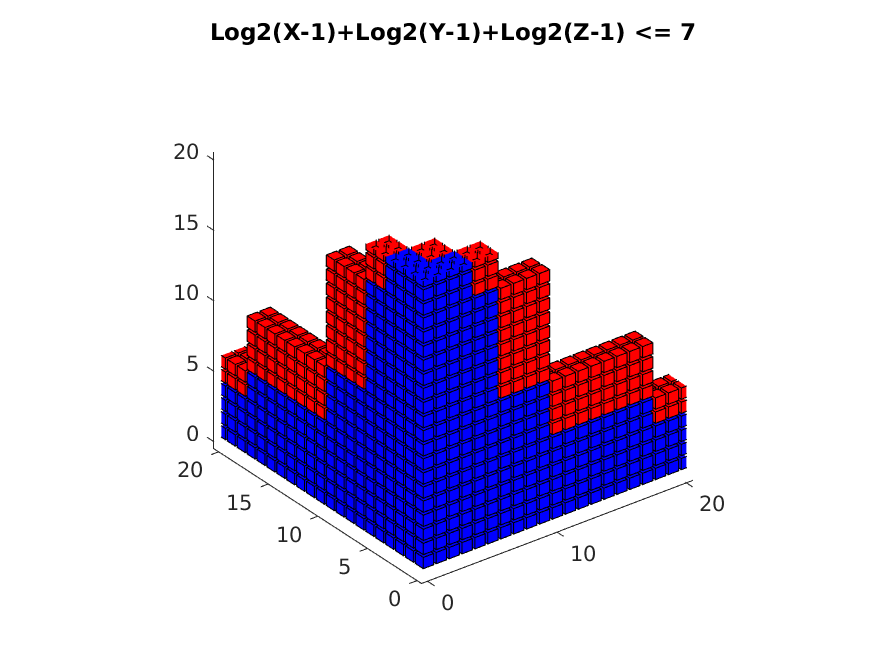
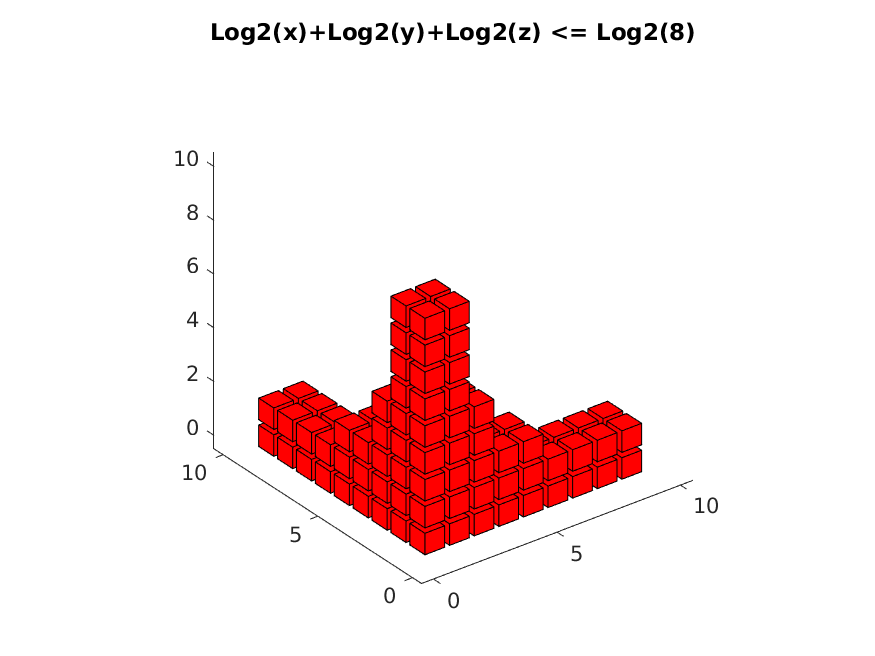
CC represents the Smolyak Clenshaw Curtis polynomials for which log2(D1-1)+log2(D2-1)+log2(D3-1) <= L. Blue indicates "old" data, and red "new".
DEGREE482 represents the monomials precisely integrated by an anisotropic quadrature rule, assuming the quadrature rule is just powerful enough to integrate x^4 and y^8 and z^2.
DEGREE8 represents the monomials precisely integrated by quadrature rules, assuming the quadrature rule is just powerful enough to integrate x^8 and y^8 and z^8.
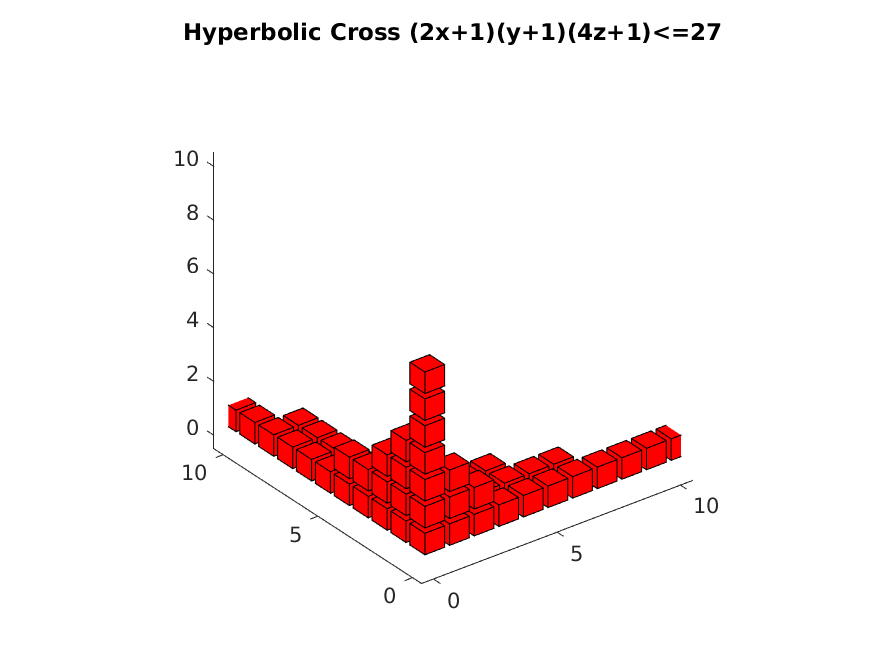
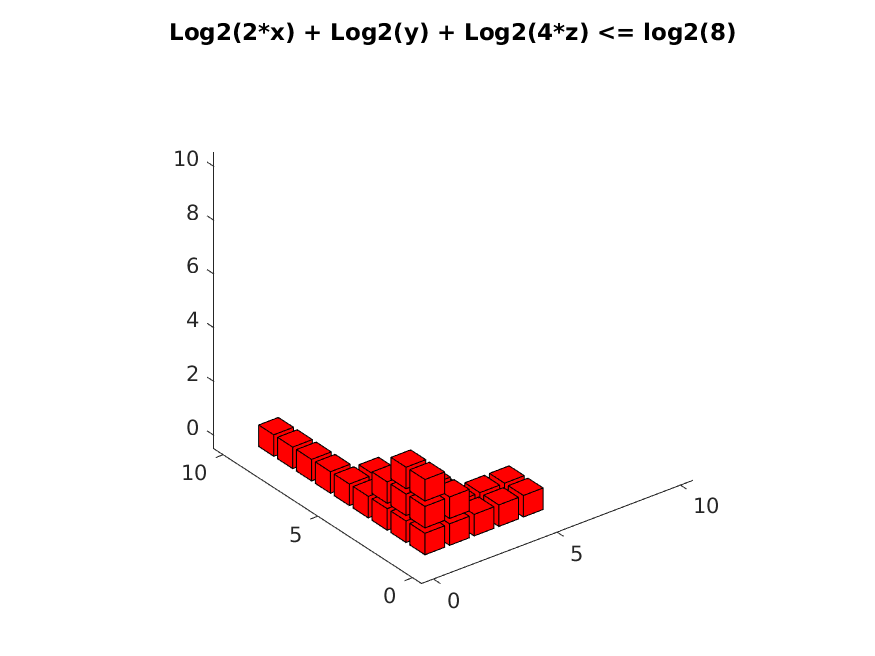
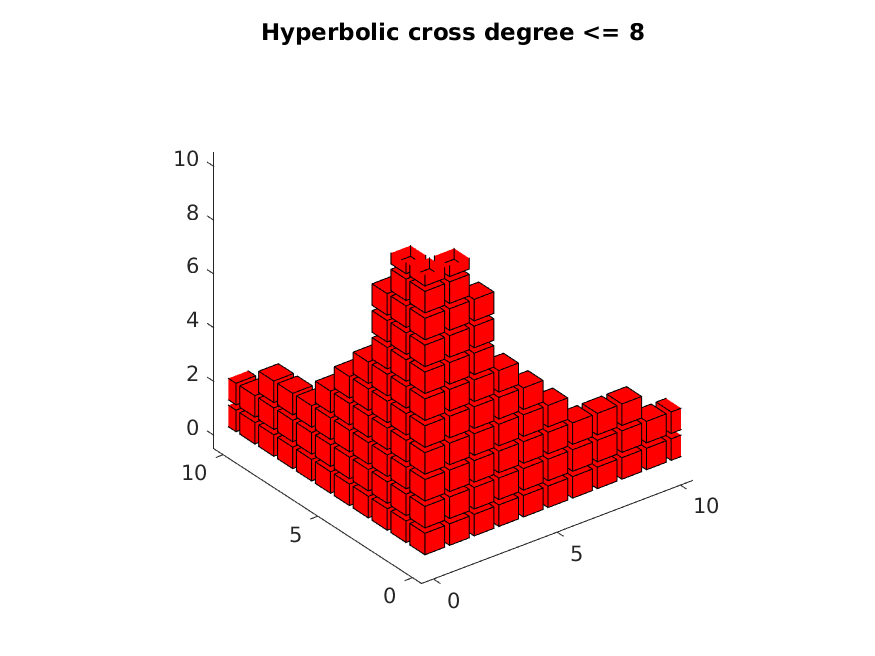
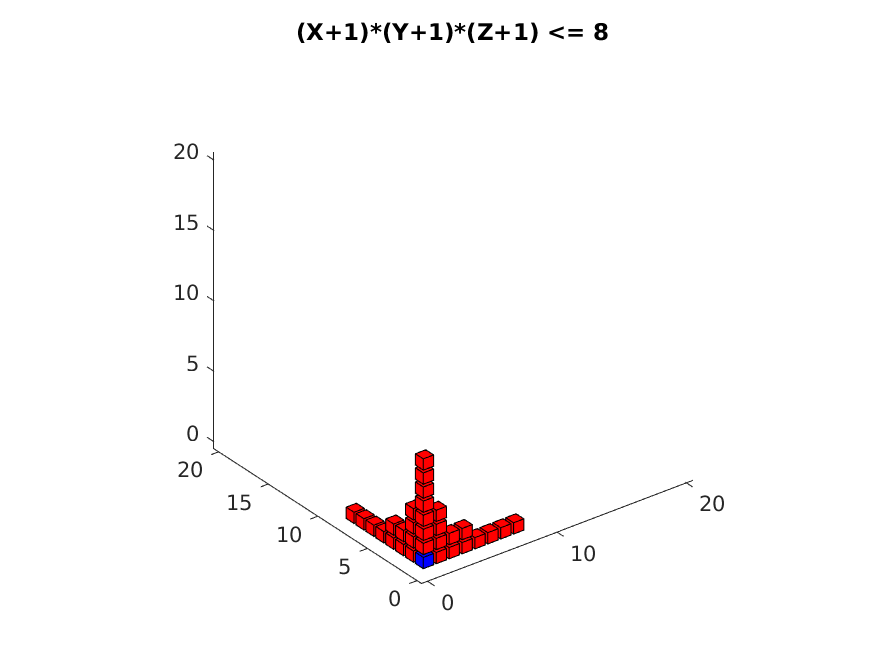
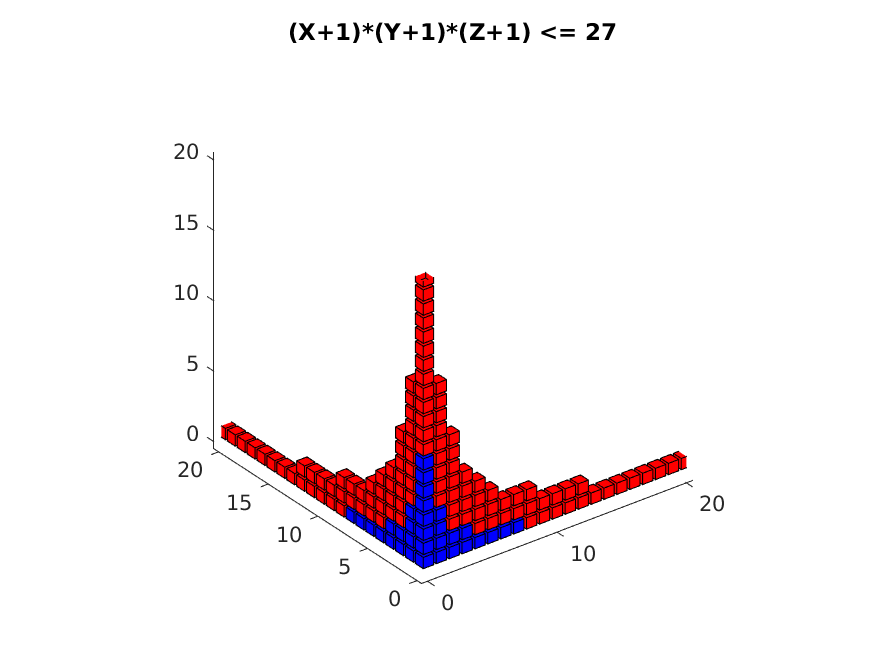
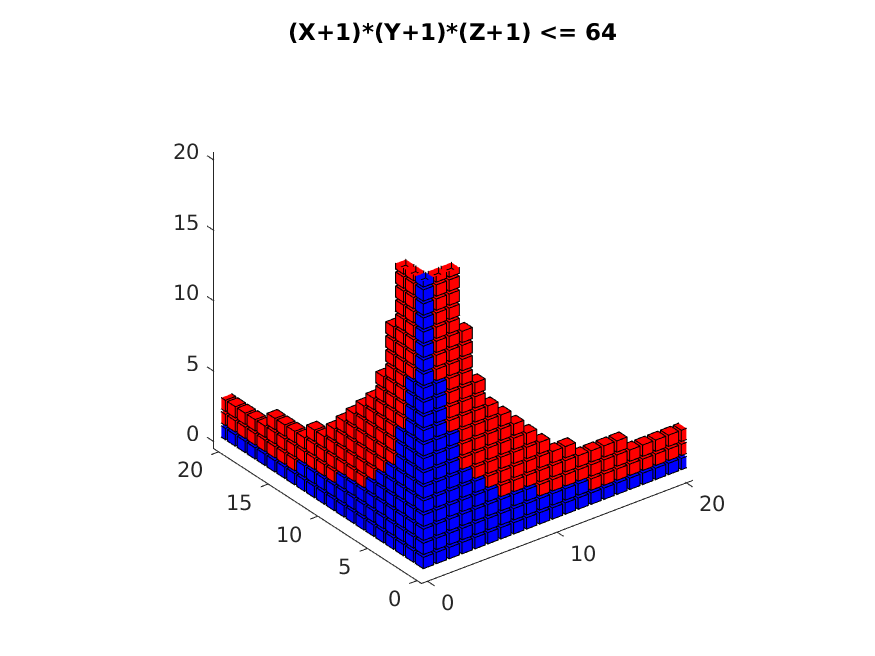
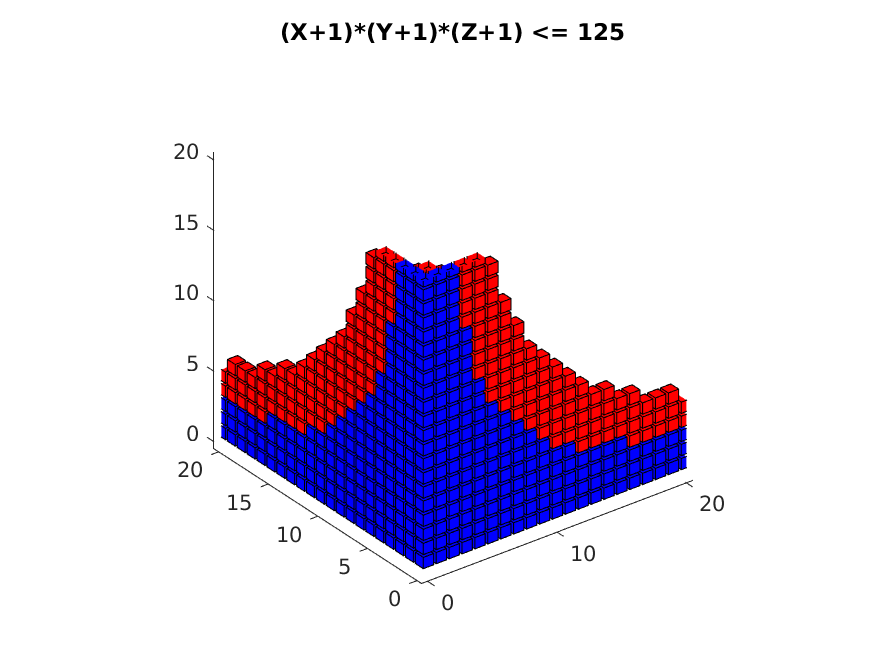
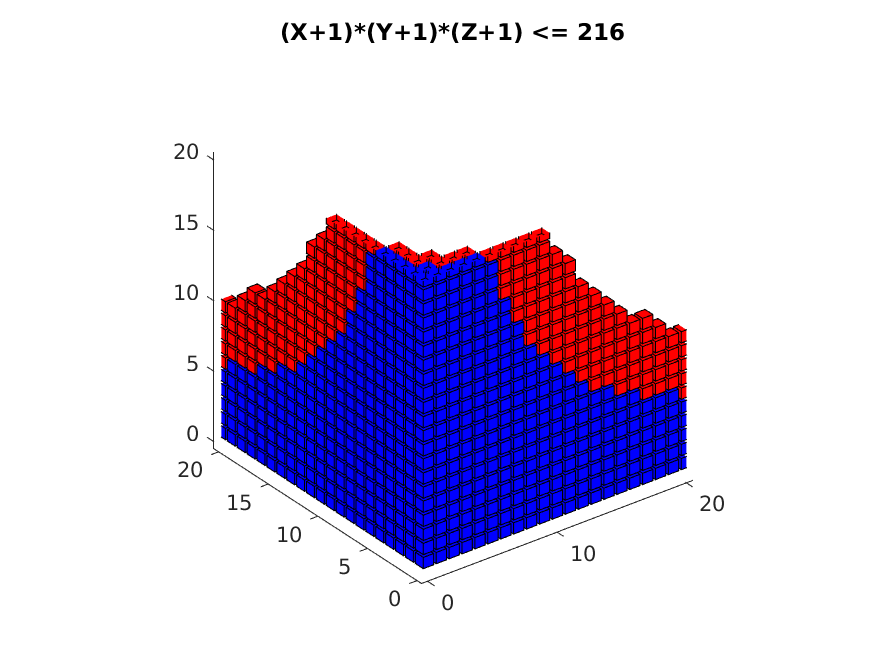
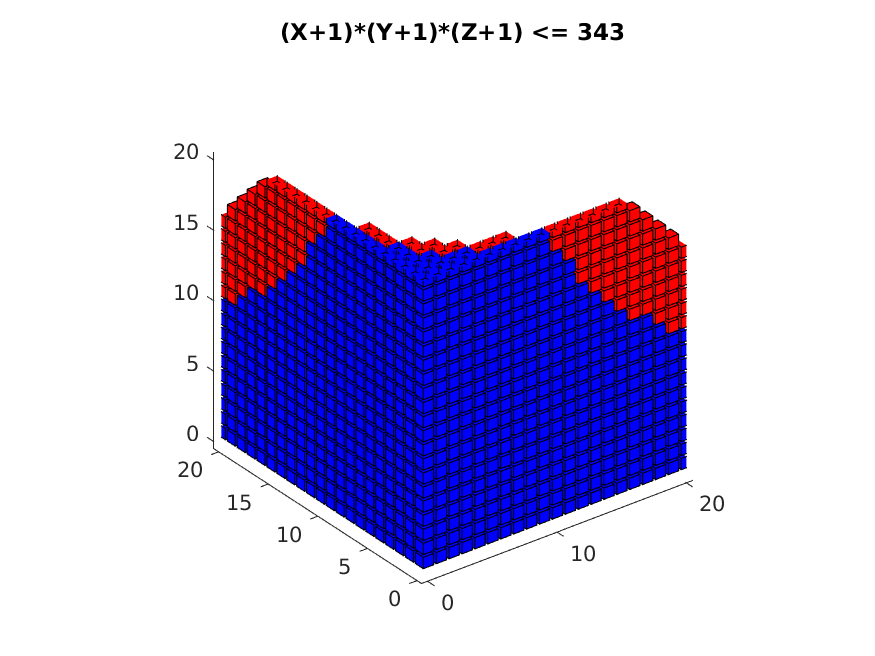
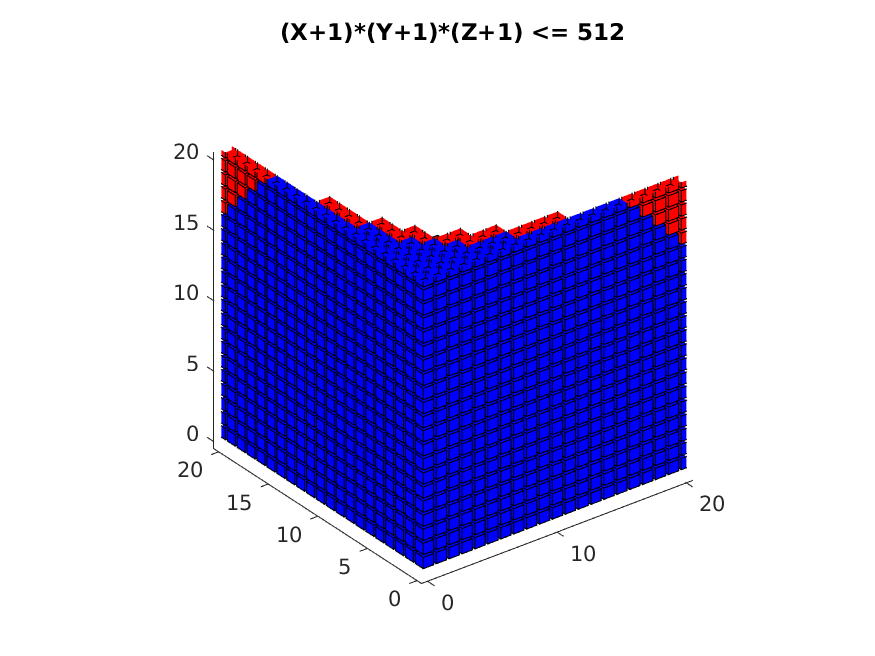
HC represents the hyperbolic cross polynomials for which (D1+1)*(D2+1)*(D3+1) <= L. Blue indicates "old" data, and red "new".
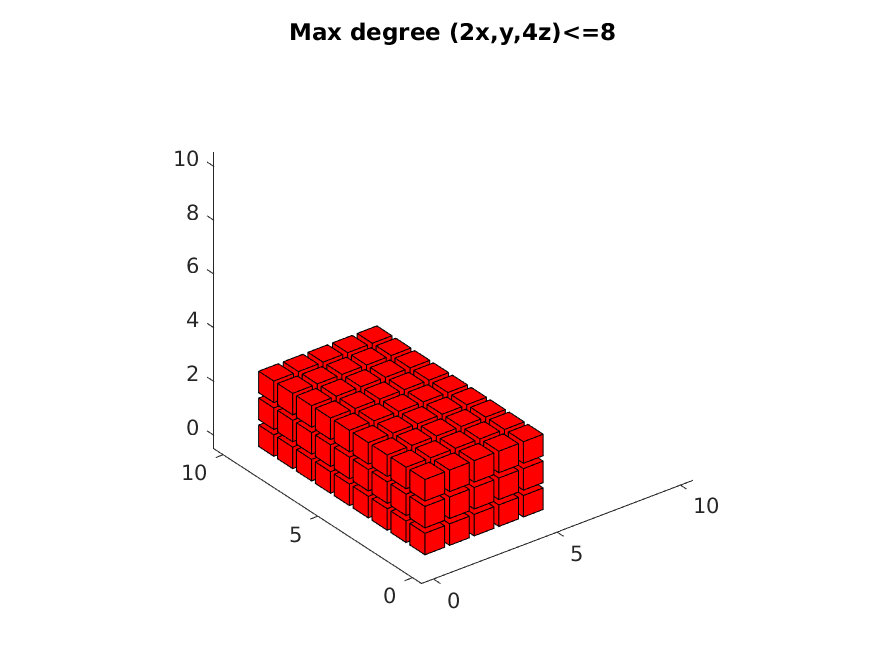
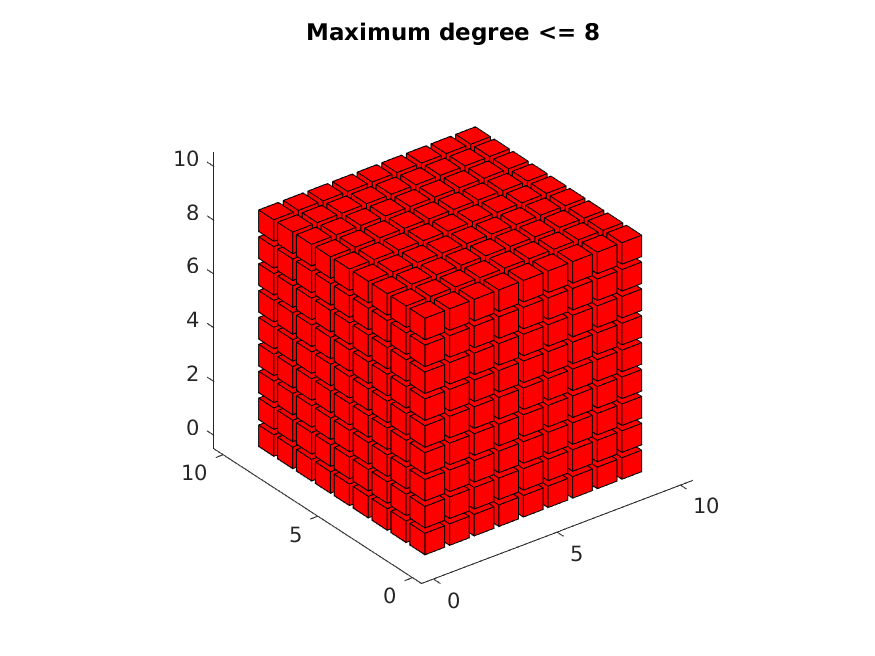
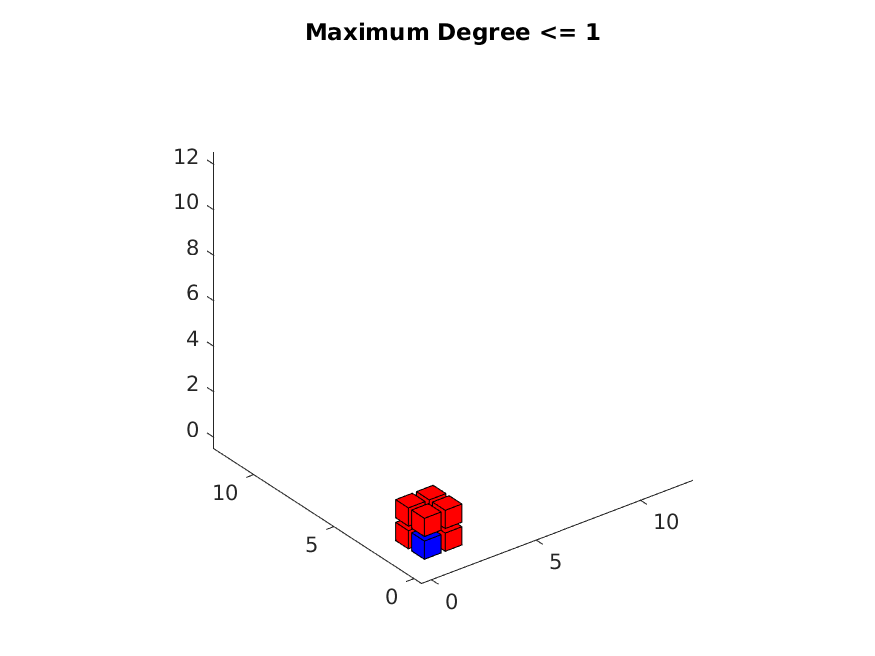
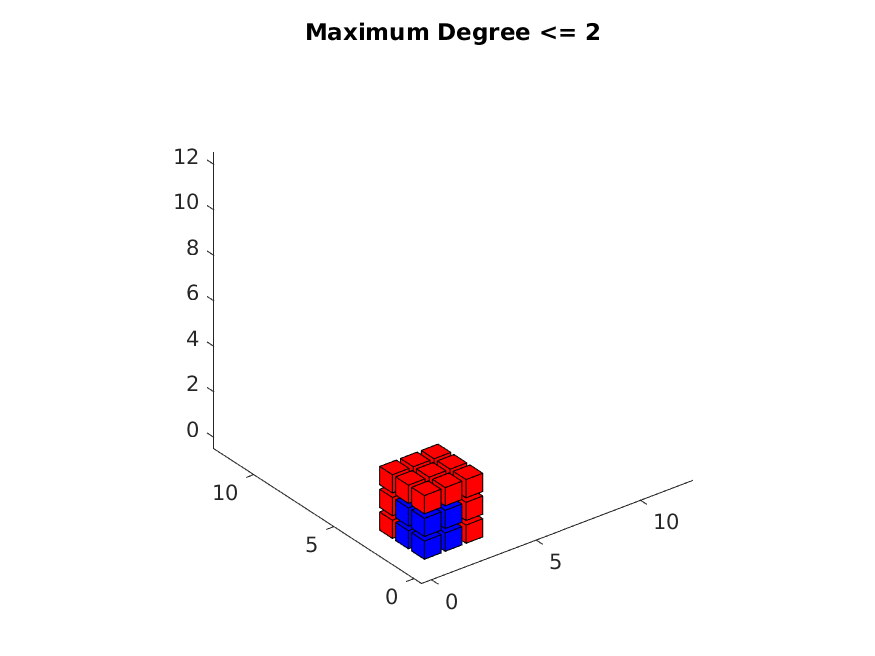
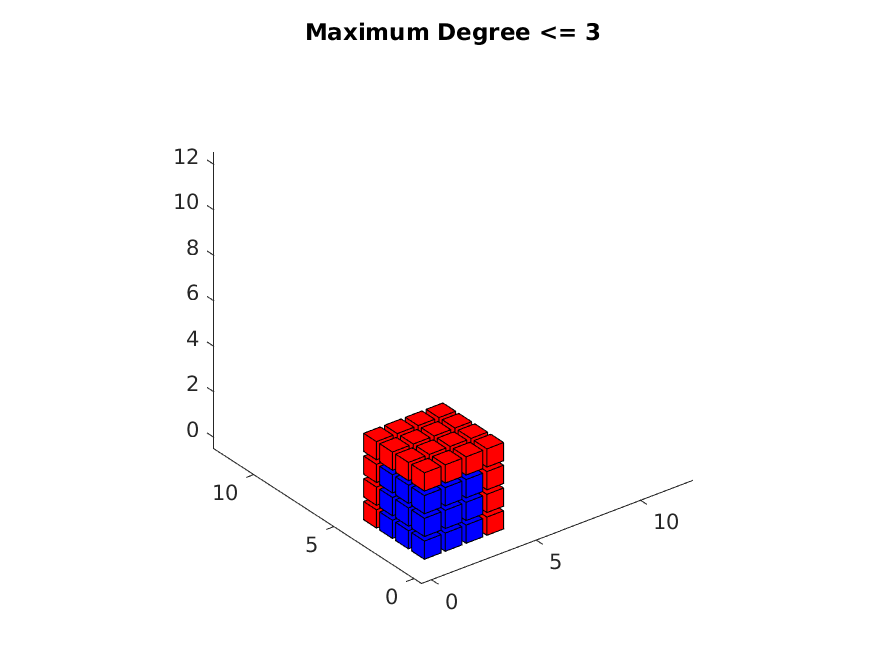
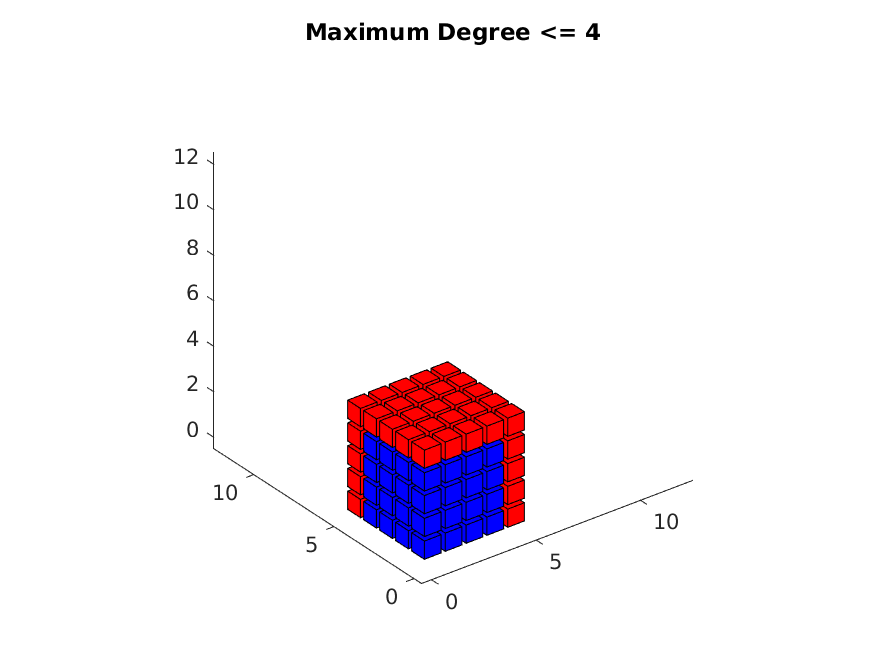
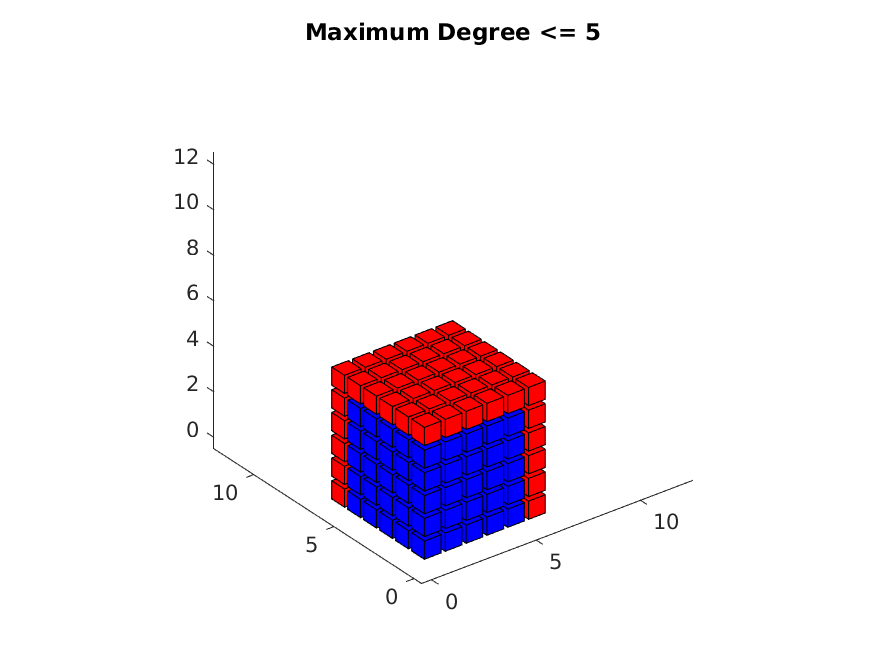
MD represents the maximum degree polynomials for which max ( D1, D2, D3 ) <= L. Blue indicates "old" data, and red "new".
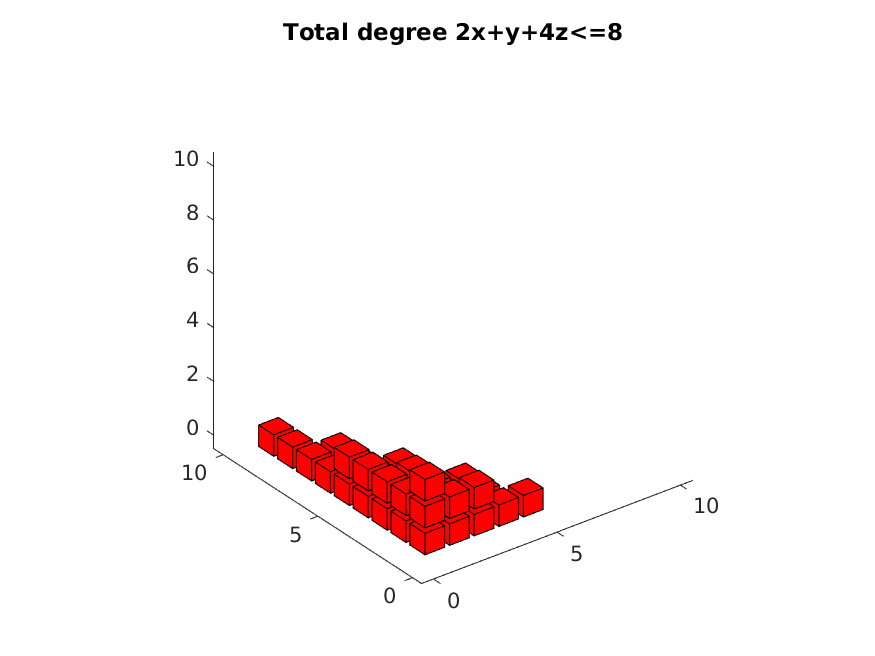
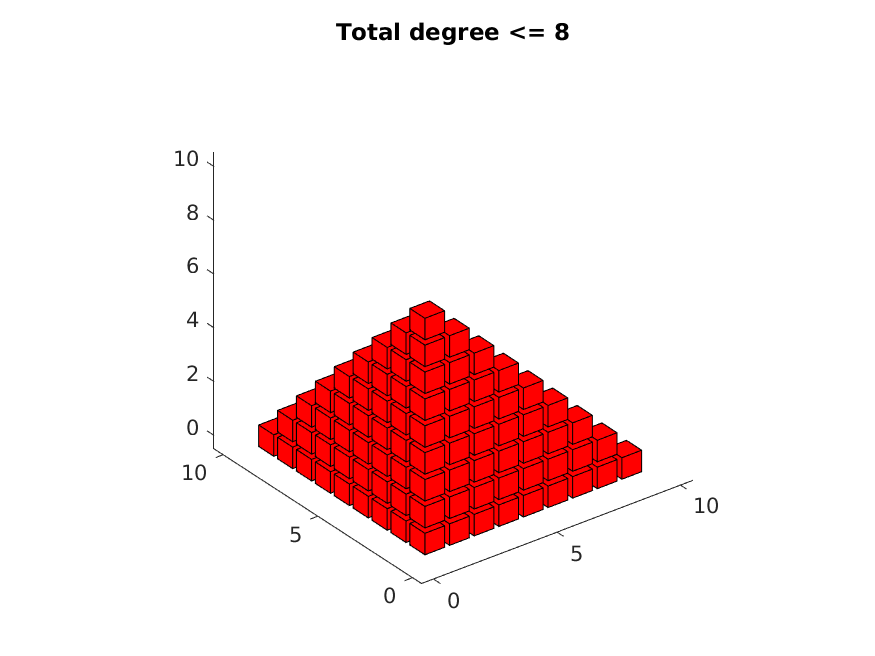
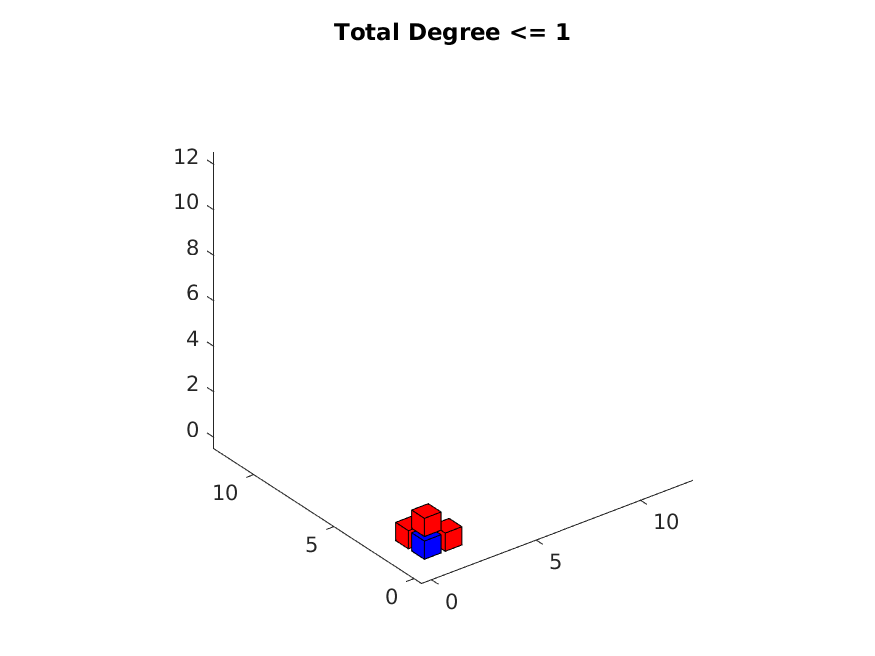
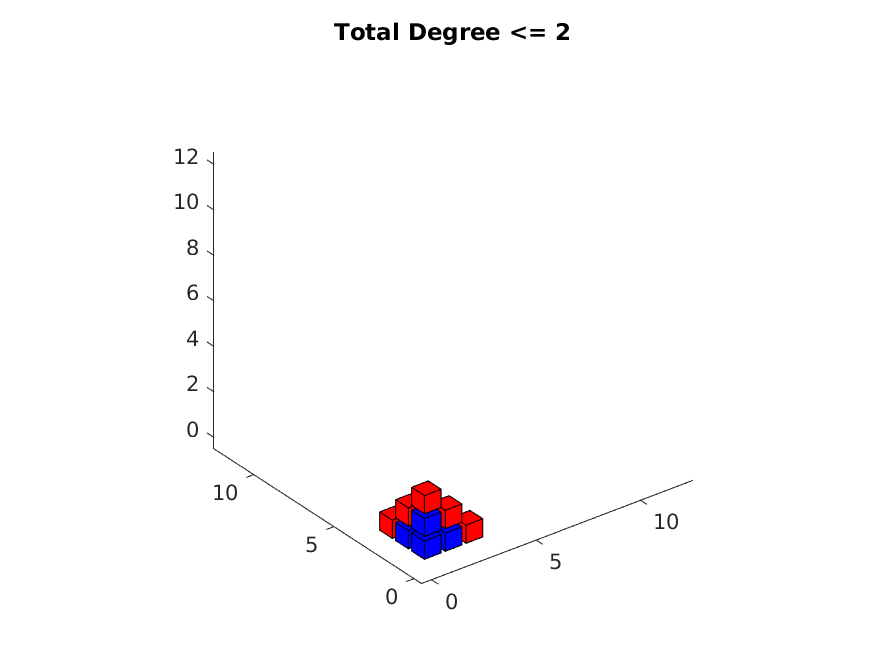
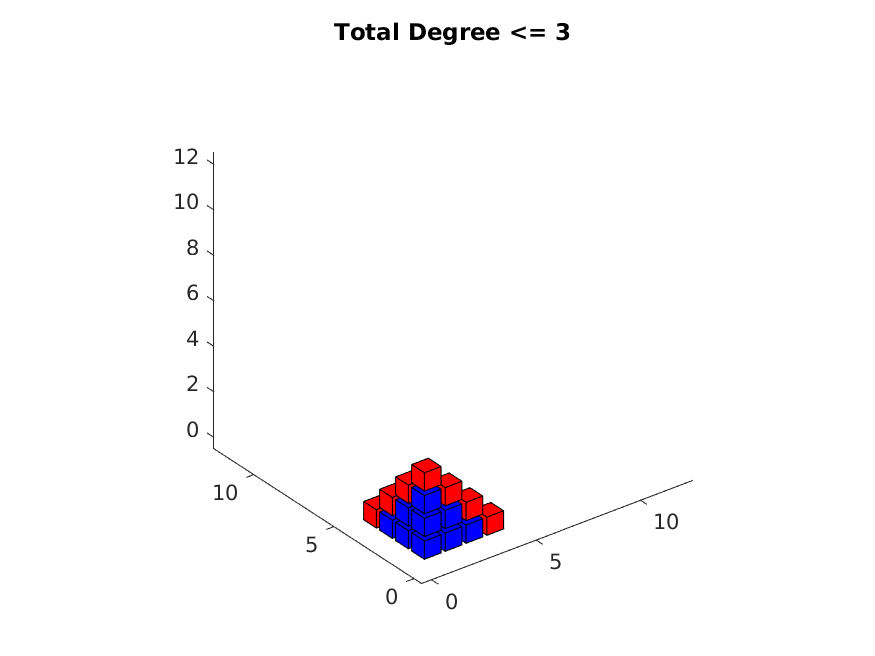
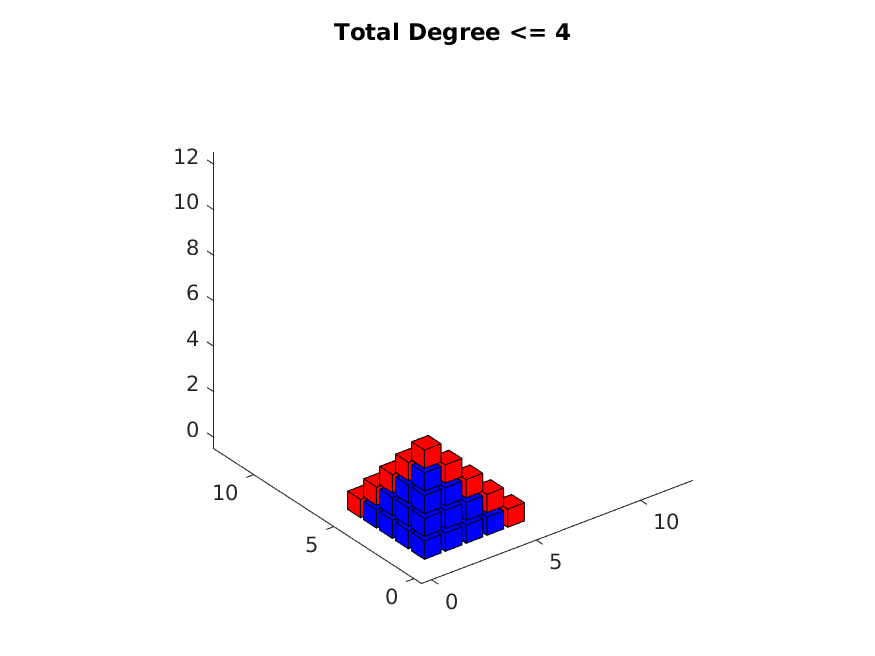
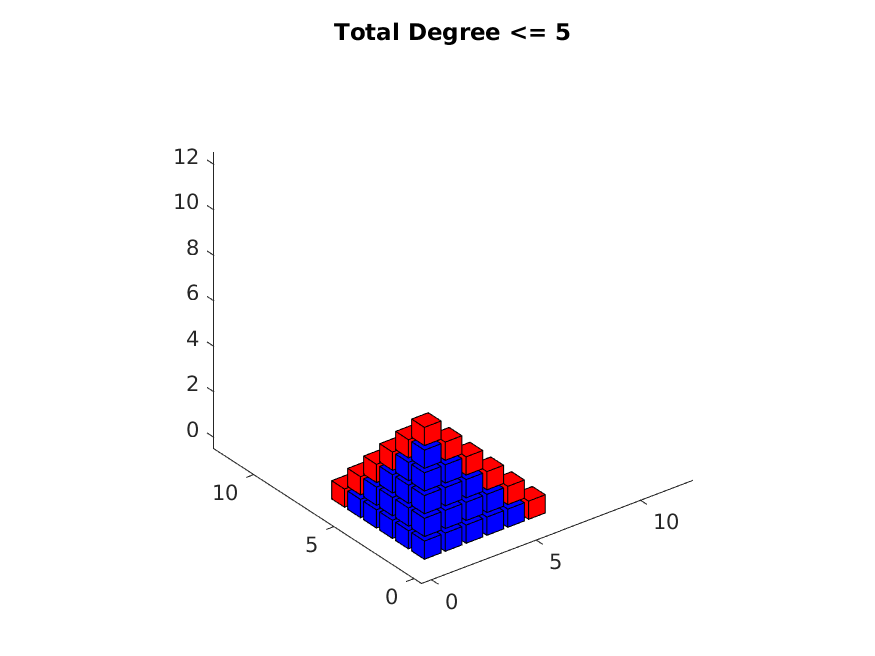
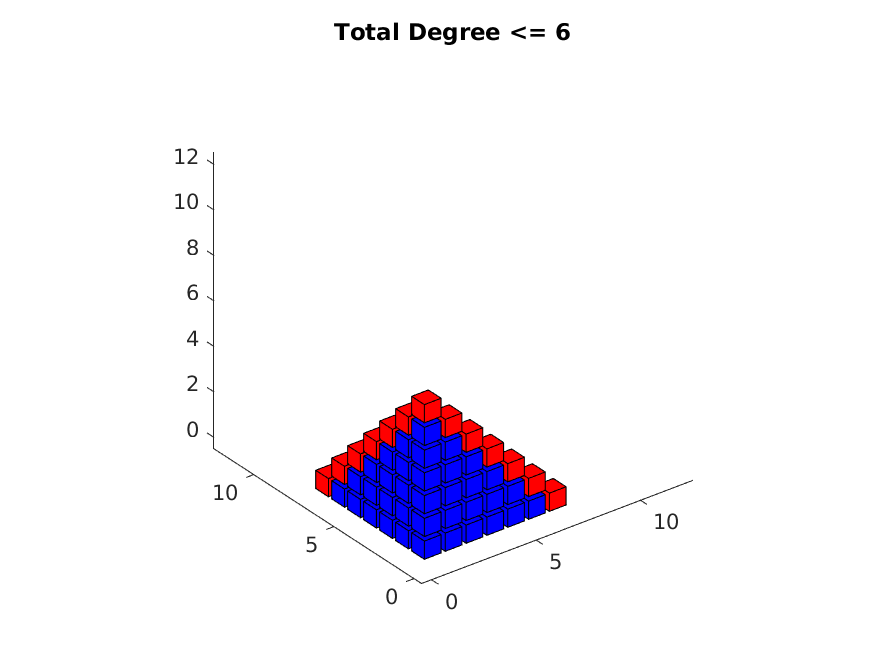
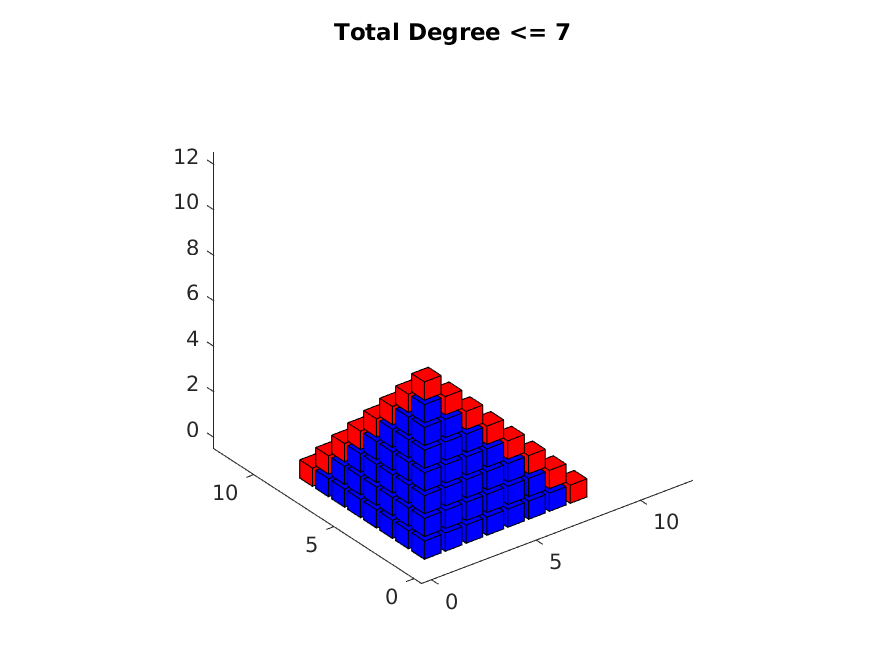
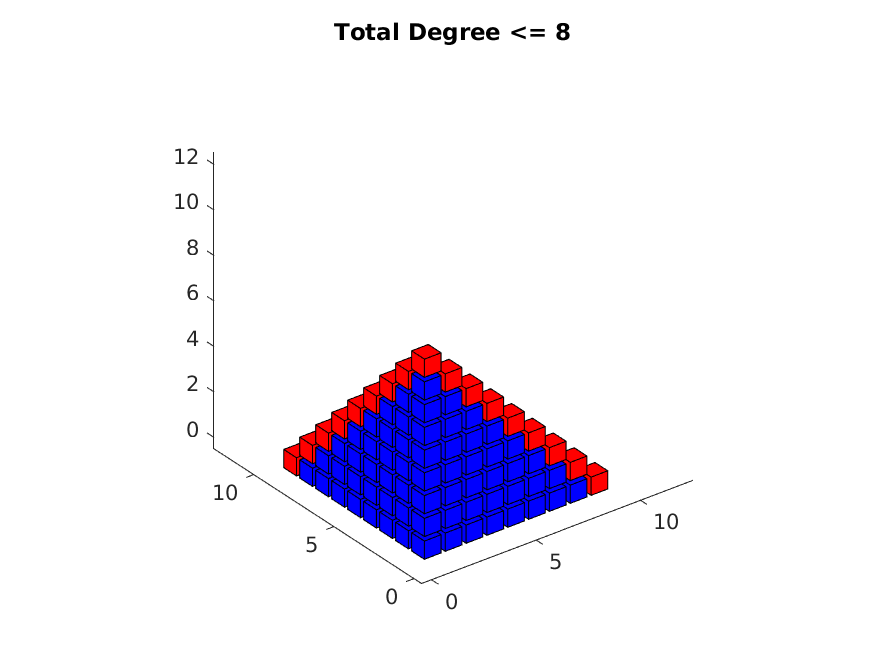
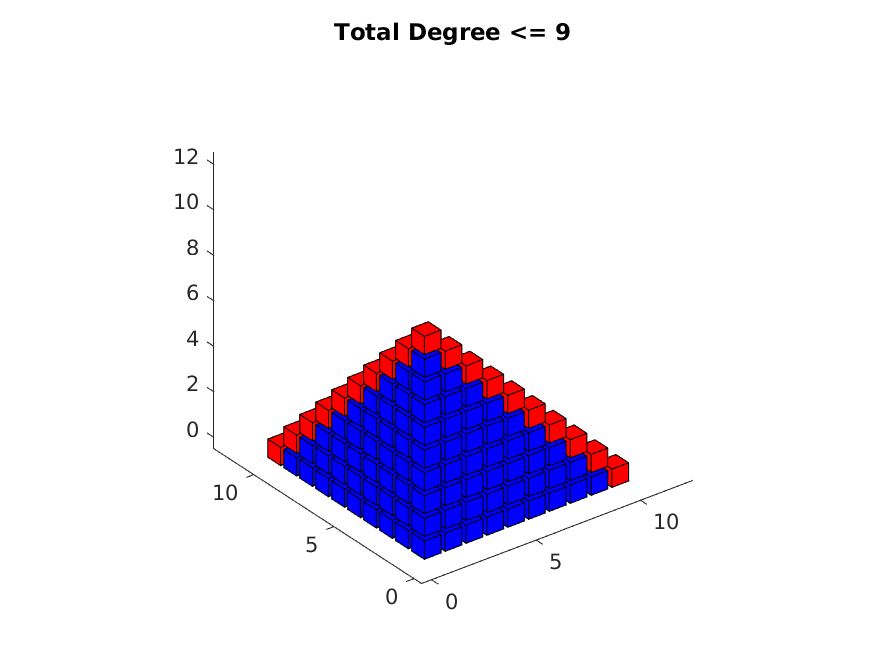
TD represents the total degree polynomials for which D1 + D2 + D3 <= L. Blue indicates "old" data, and red "new".