box_plot_test
box_plot_test
is a MATLAB program which
calls box_plot to read a file of integer
coordinates and associated colors, and make a plot, placing a unit
box of the given color at each coordinate.
Licensing:
The computer code and data files described and made available on this web page
are distributed under
the GNU LGPL license.
Related Data and Programs:
box_plot,
a MATLAB program which
displays a box plot of data that consists of pairs of integers;
Source Code:
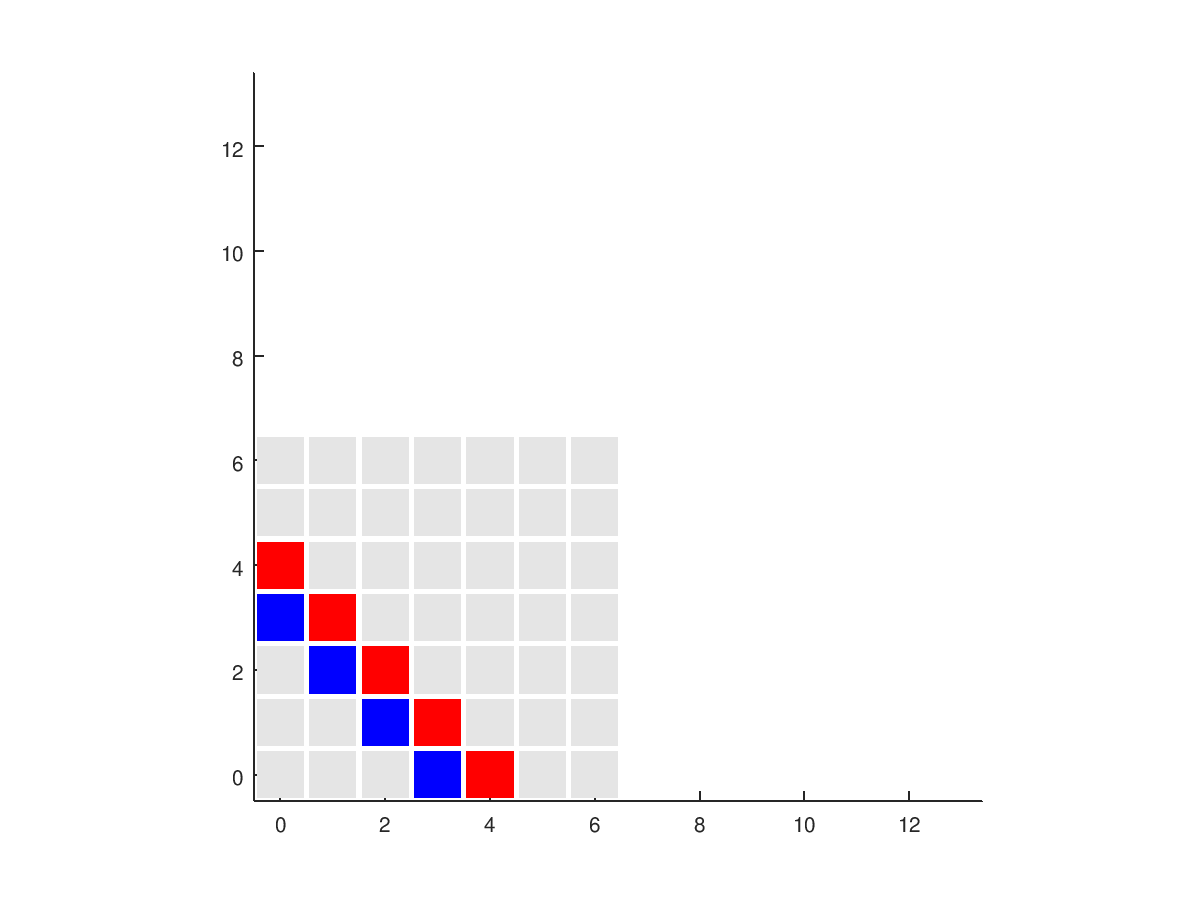
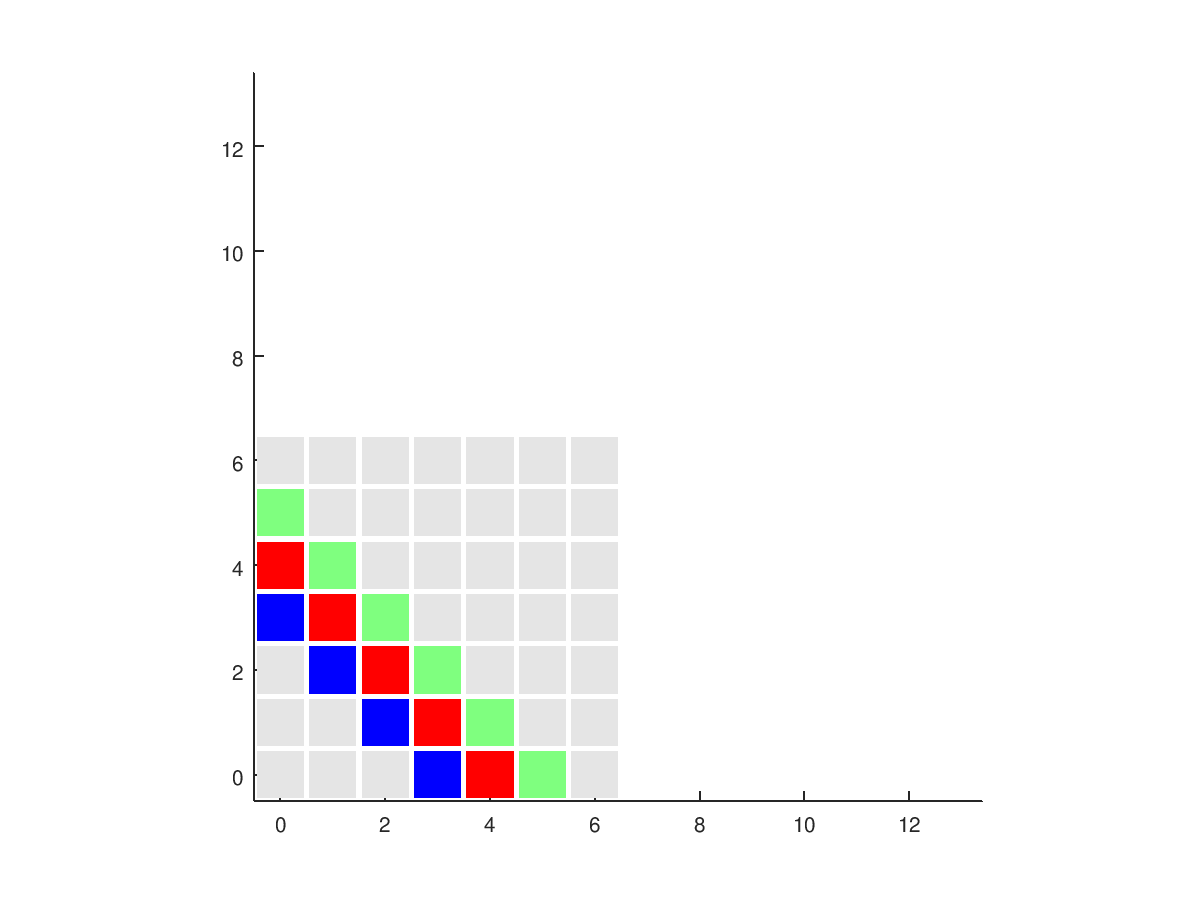
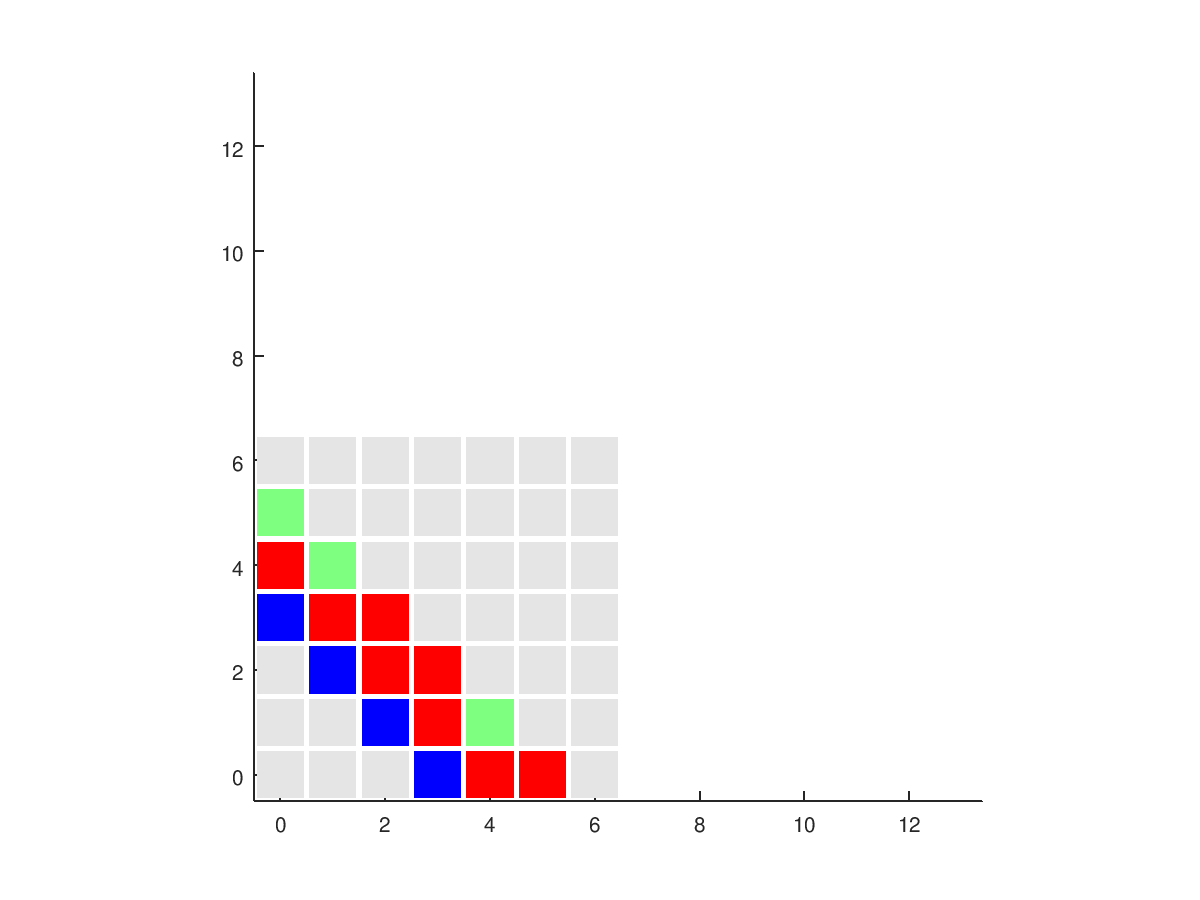
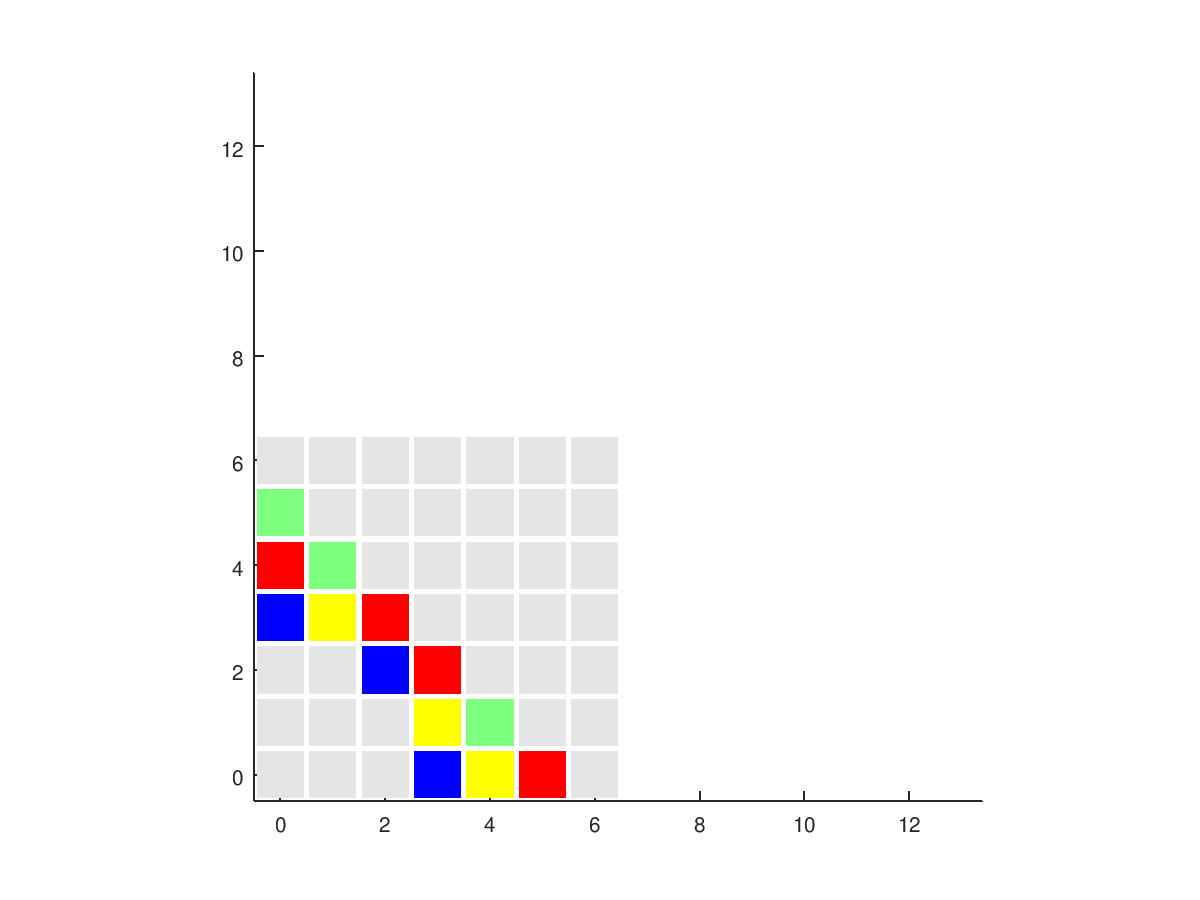
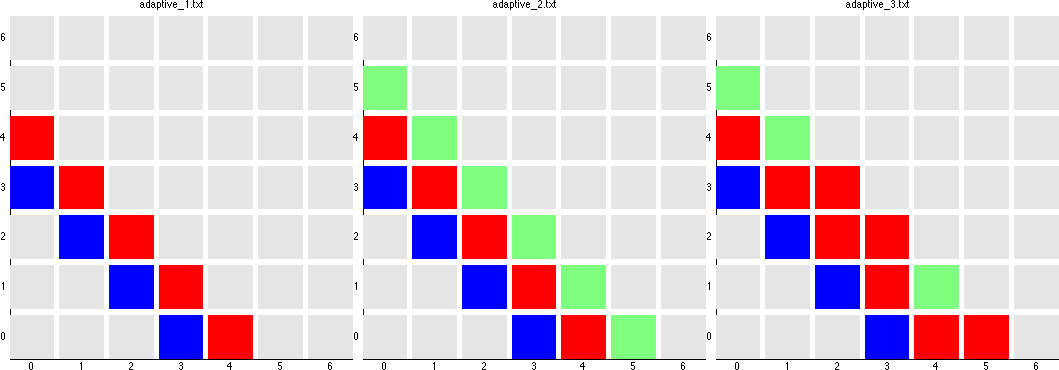
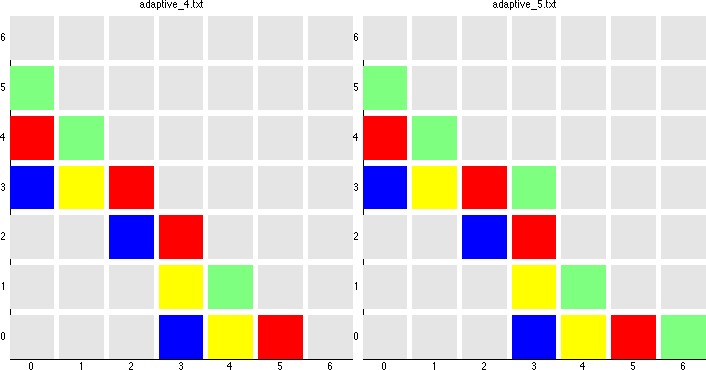
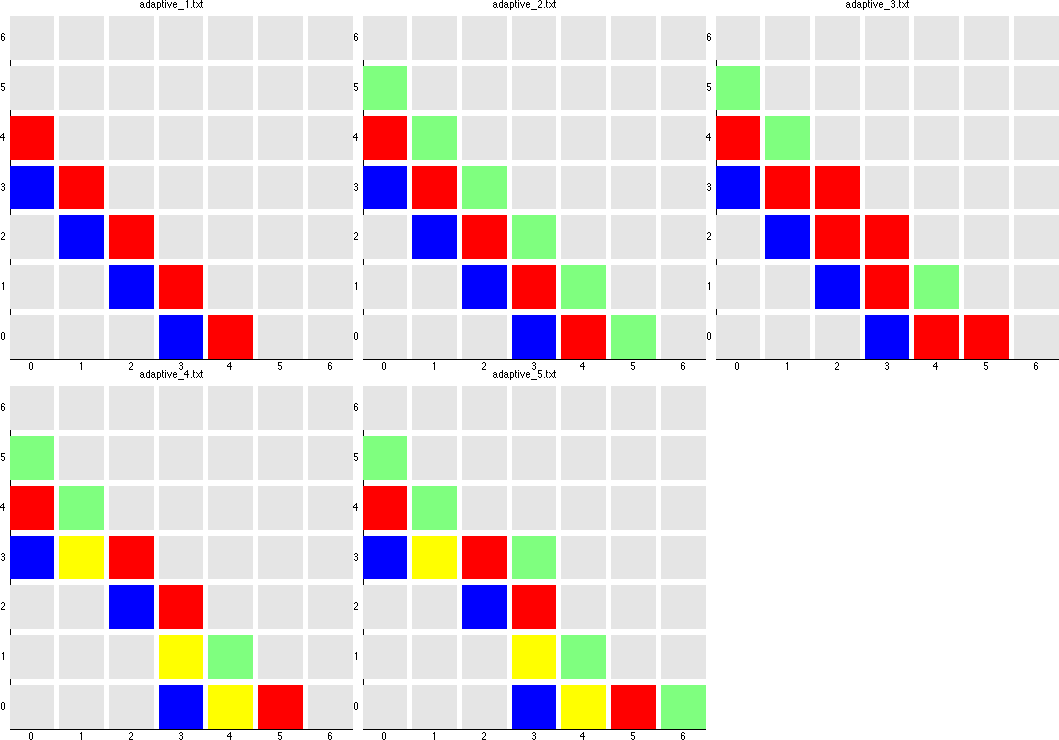
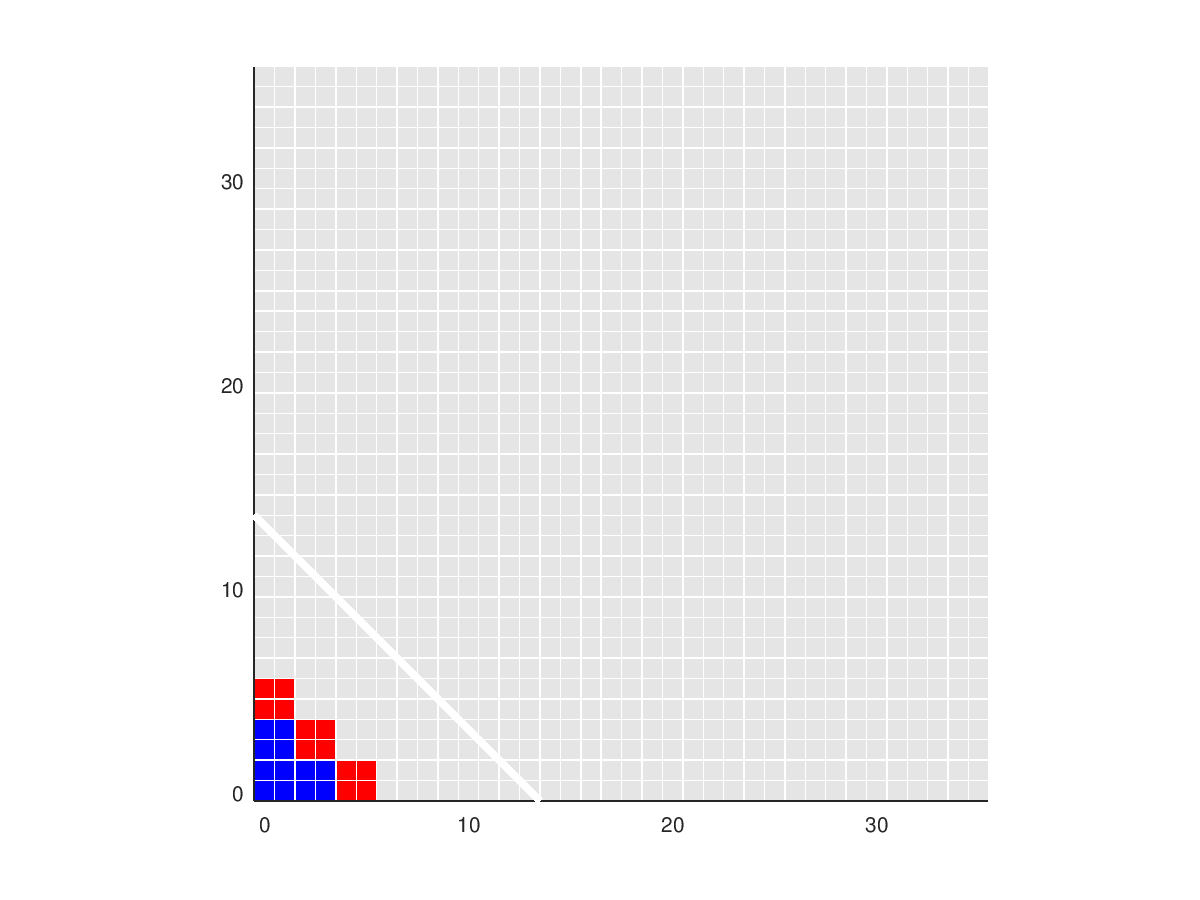
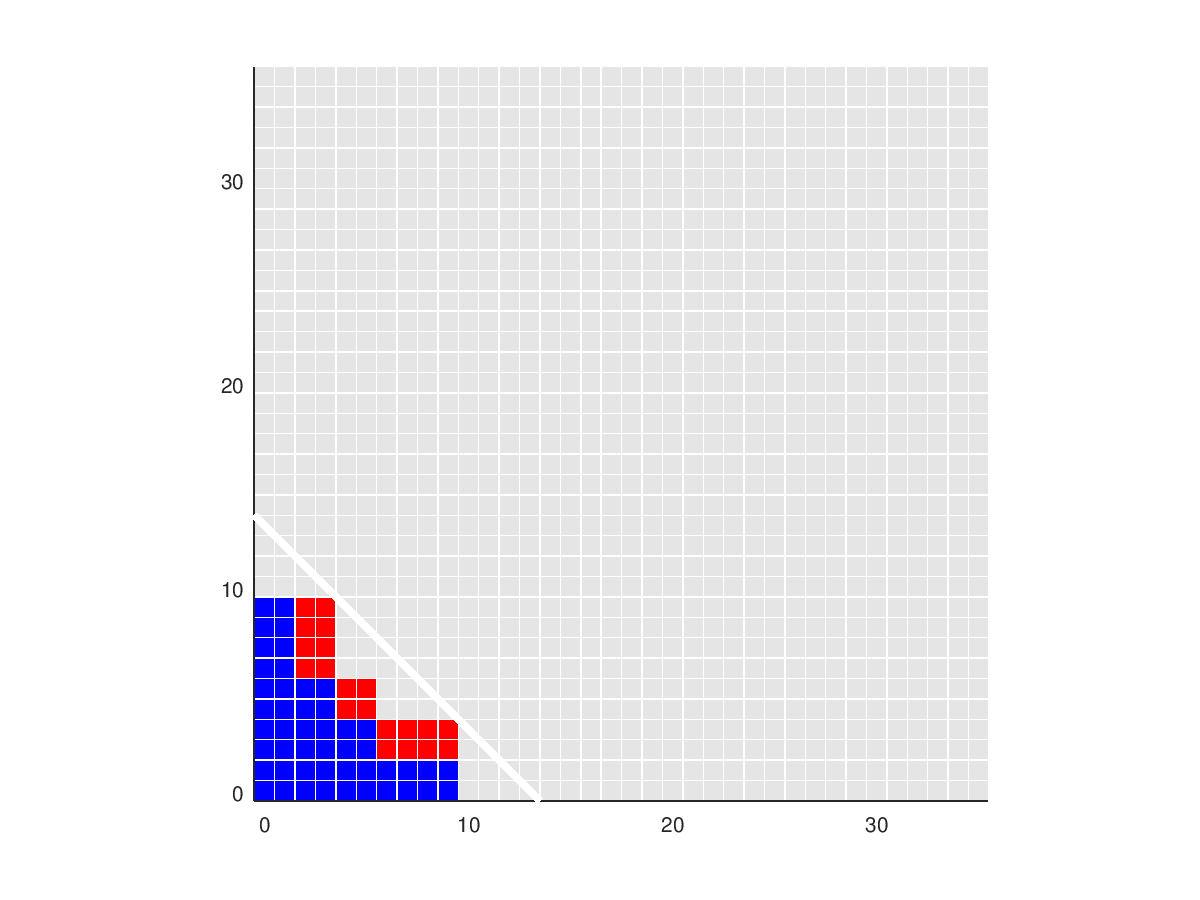
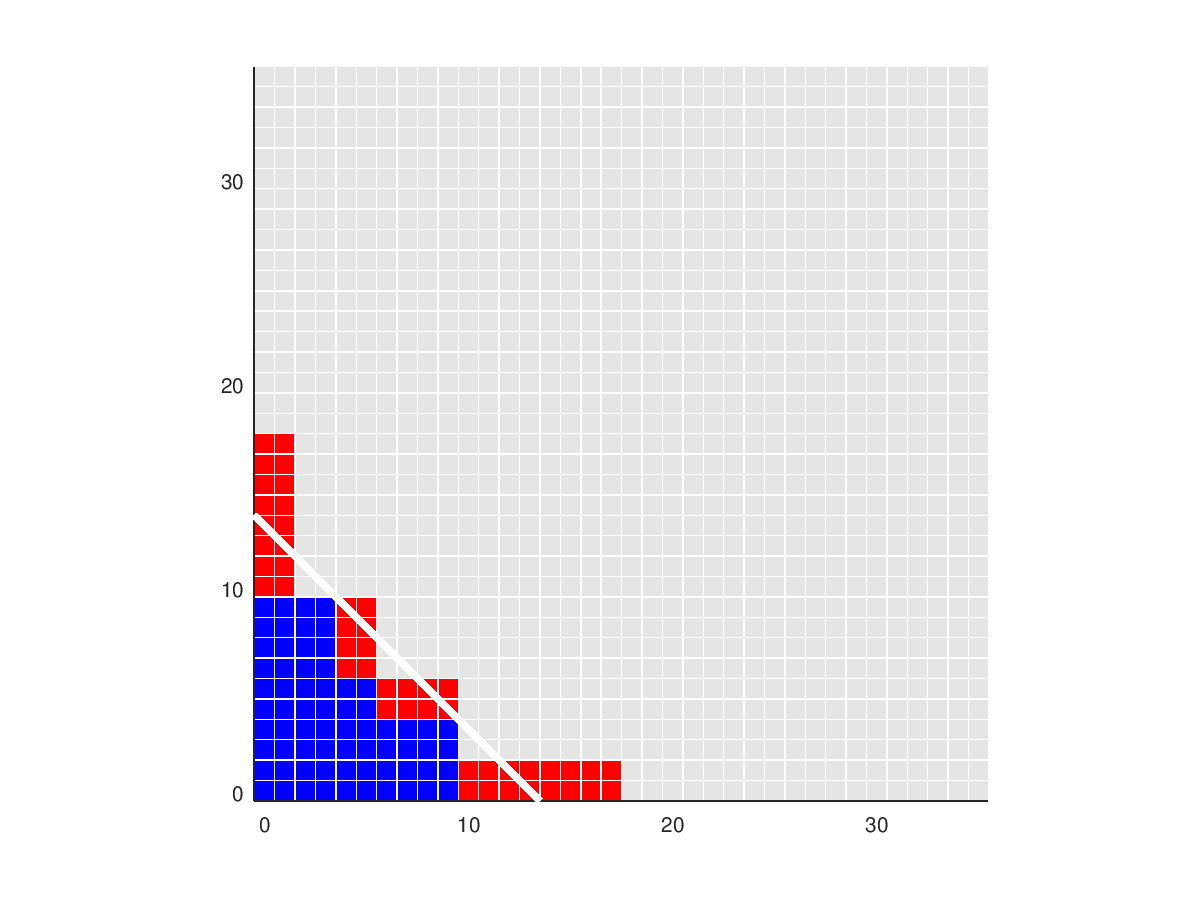
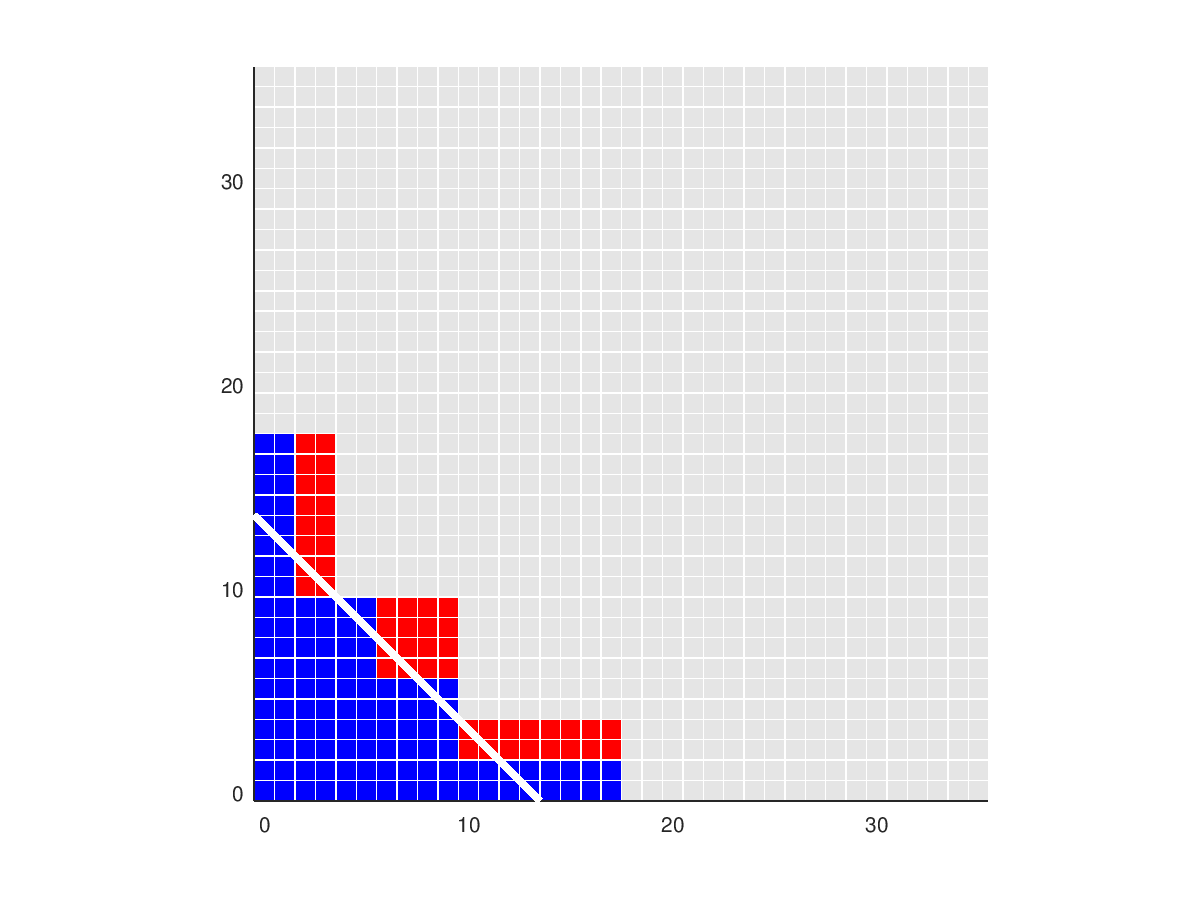
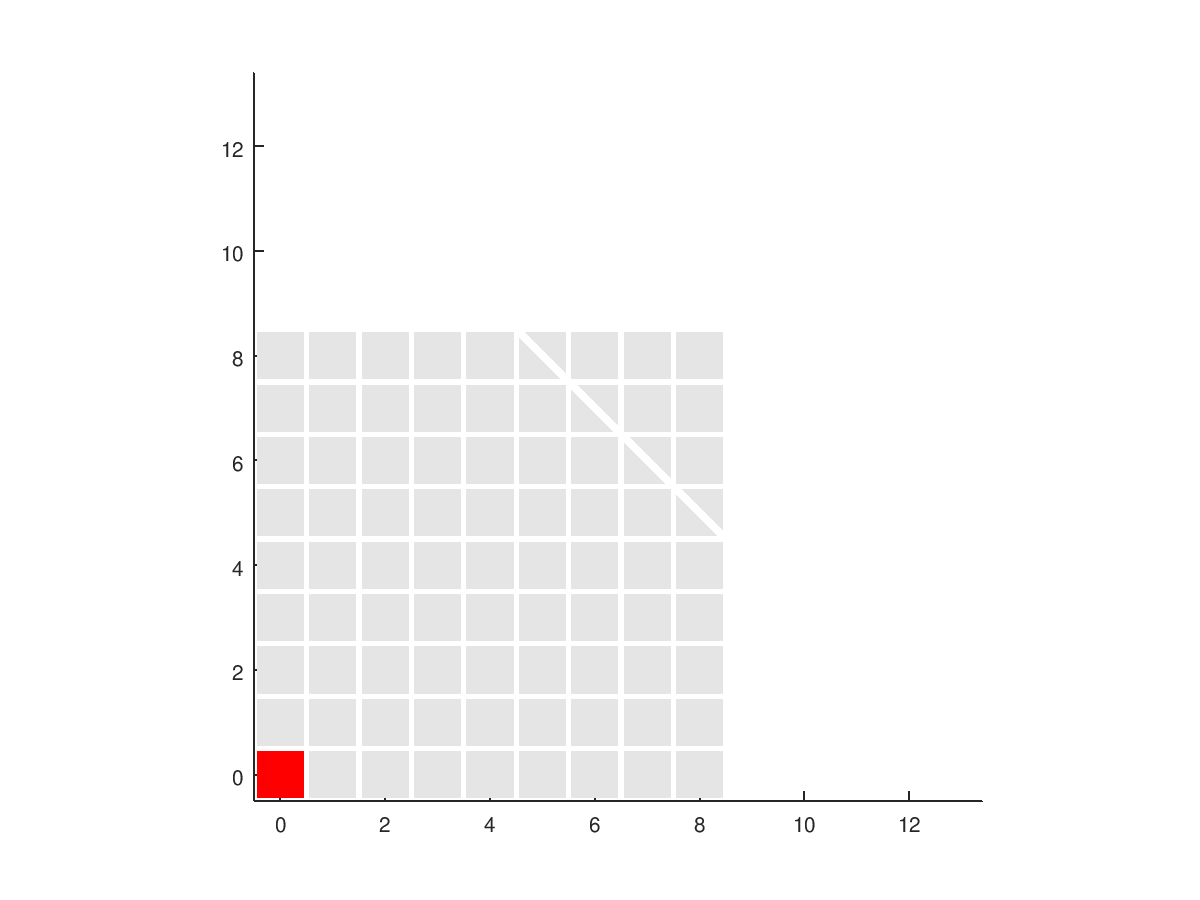
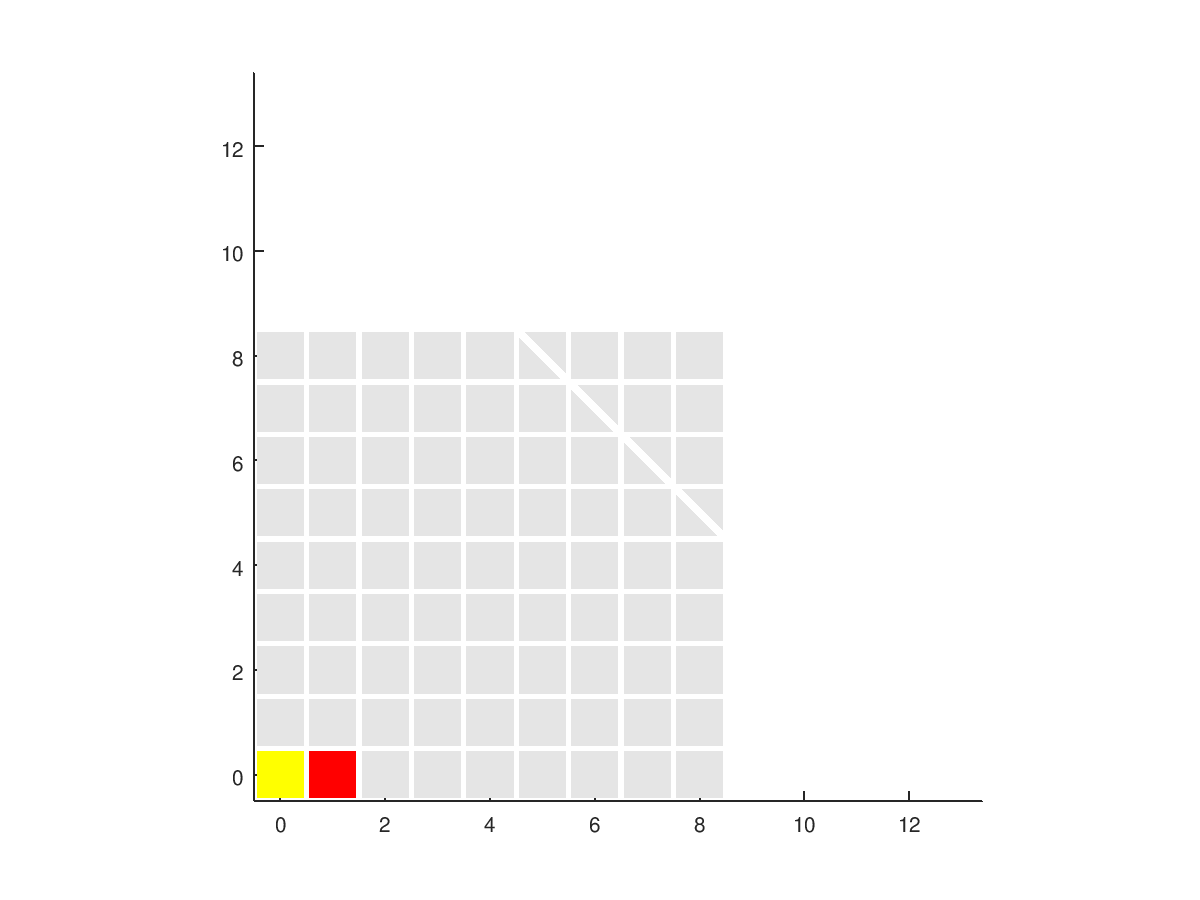
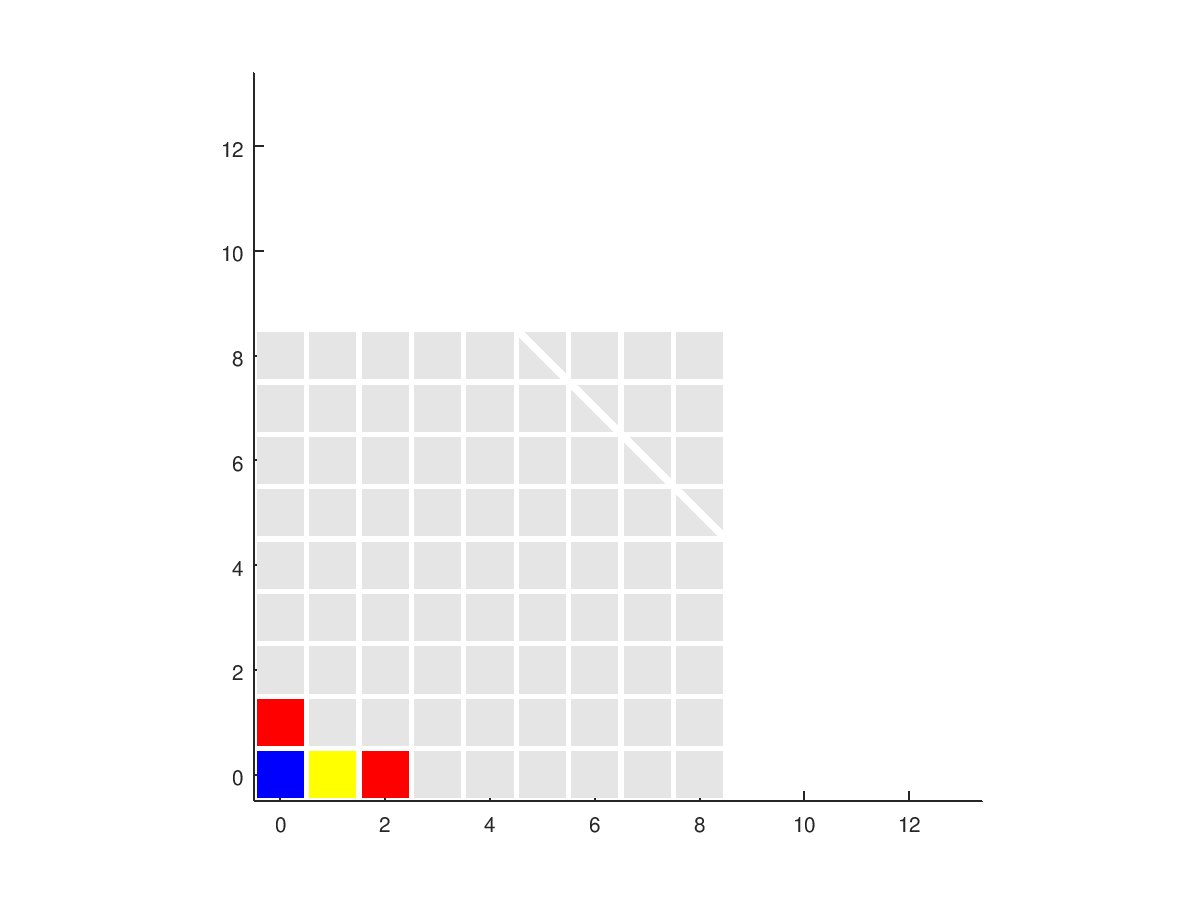
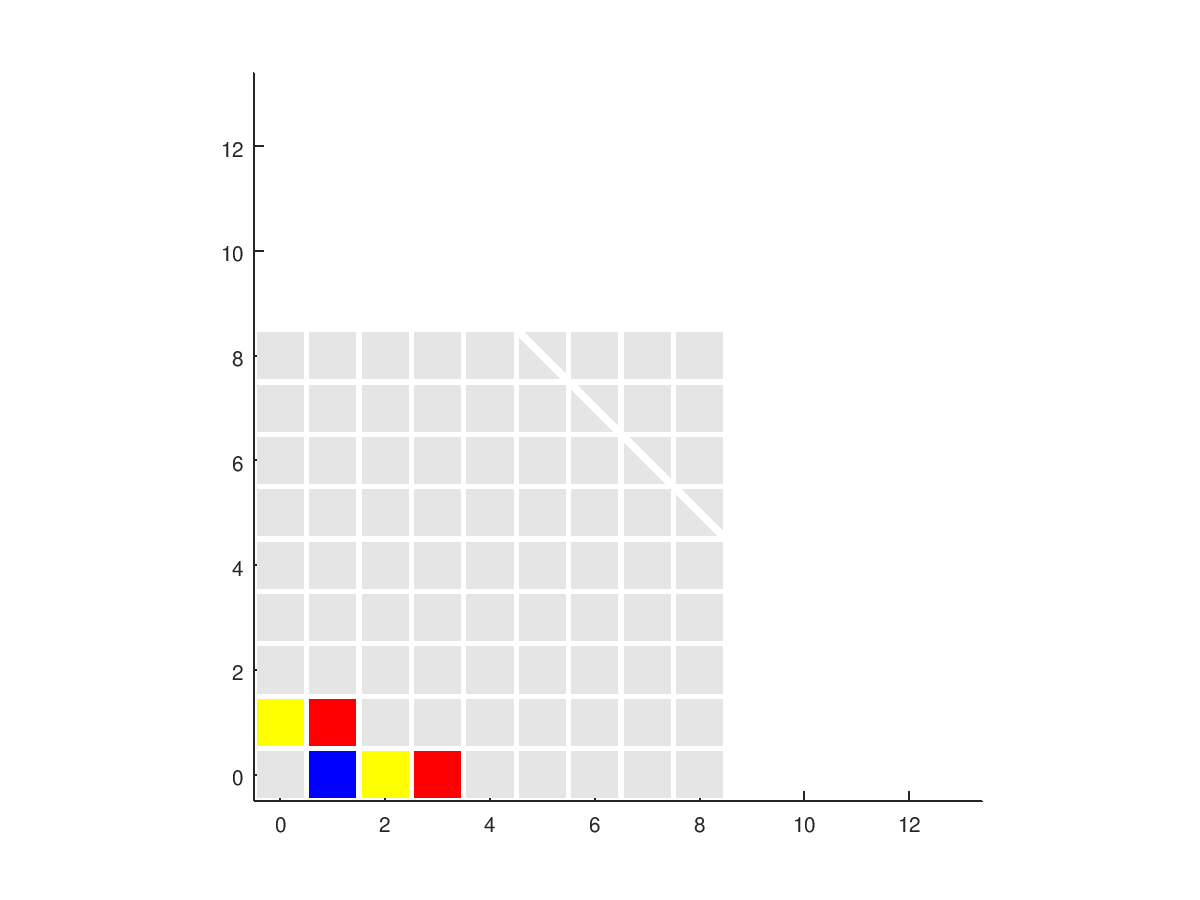
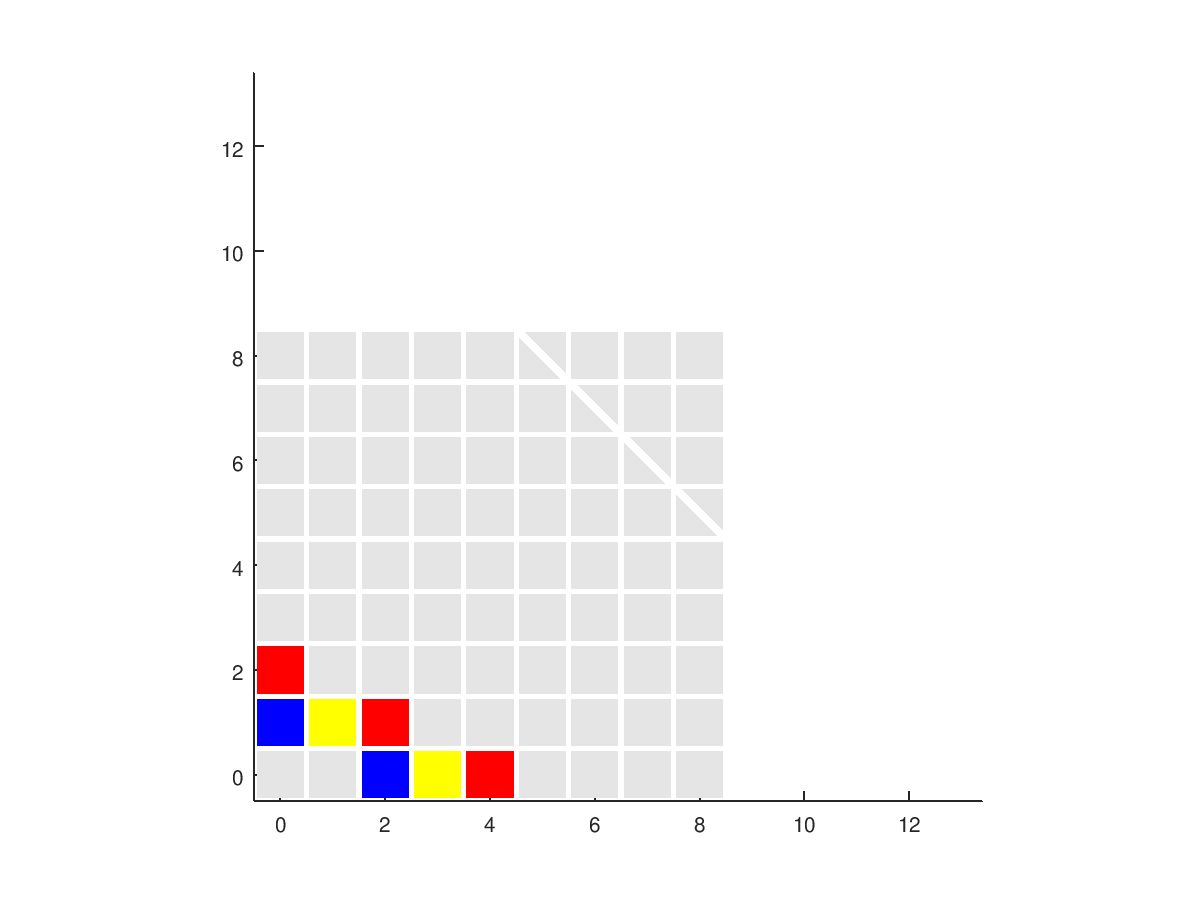
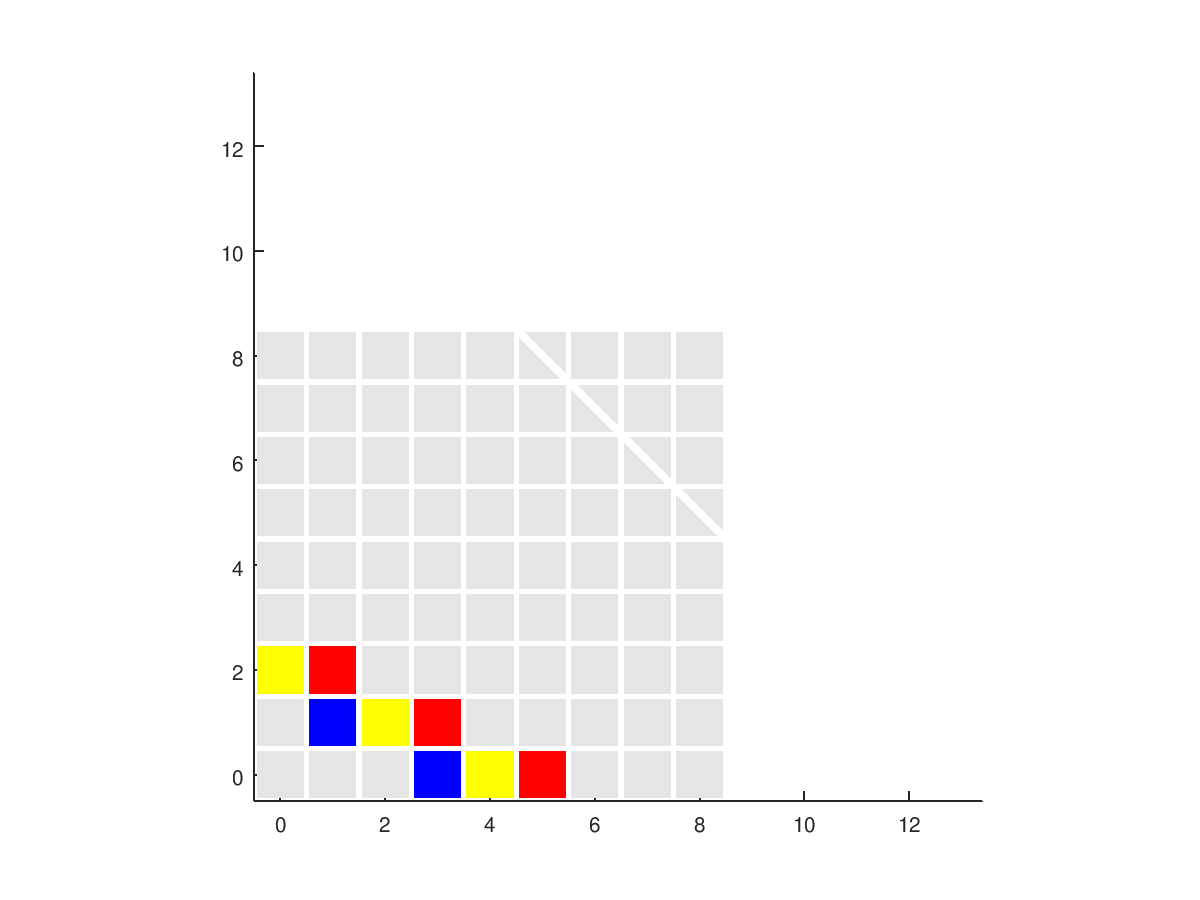
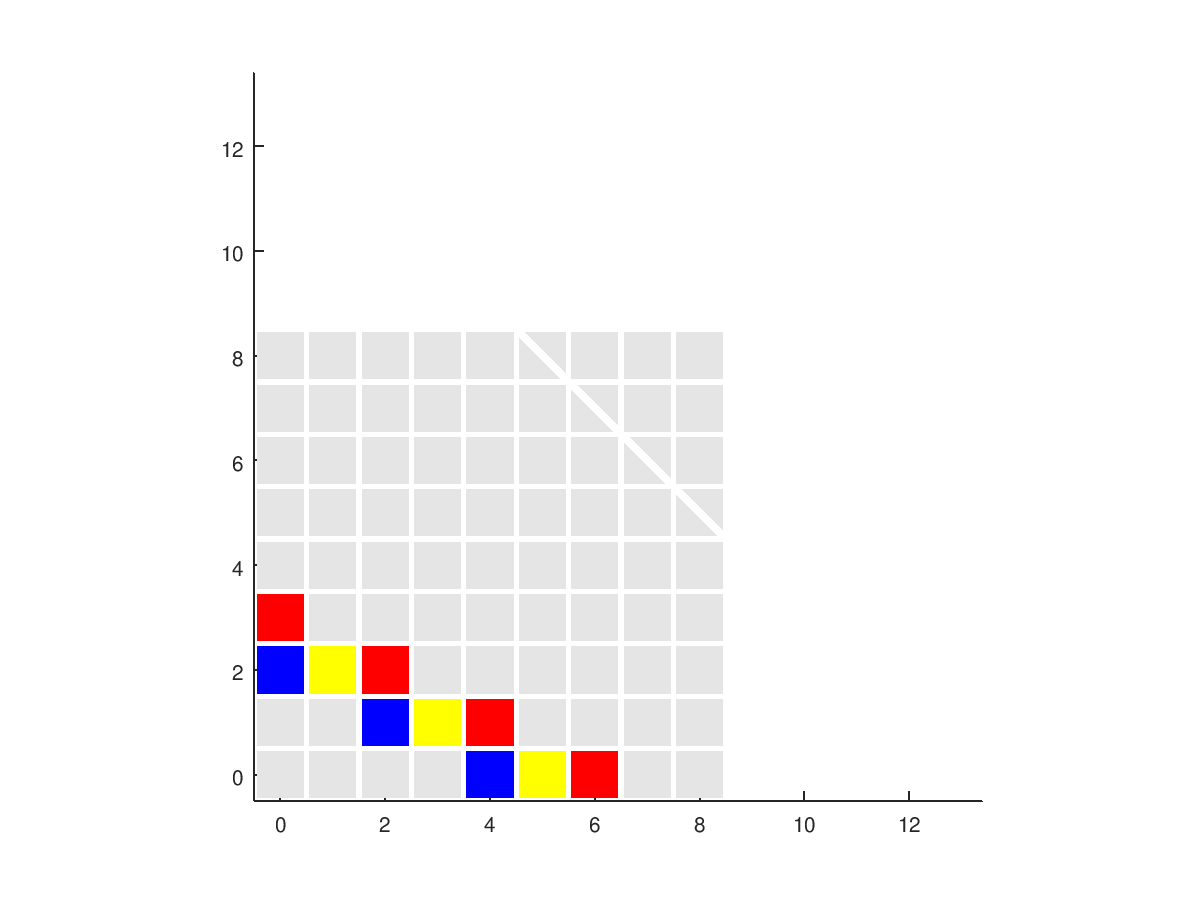
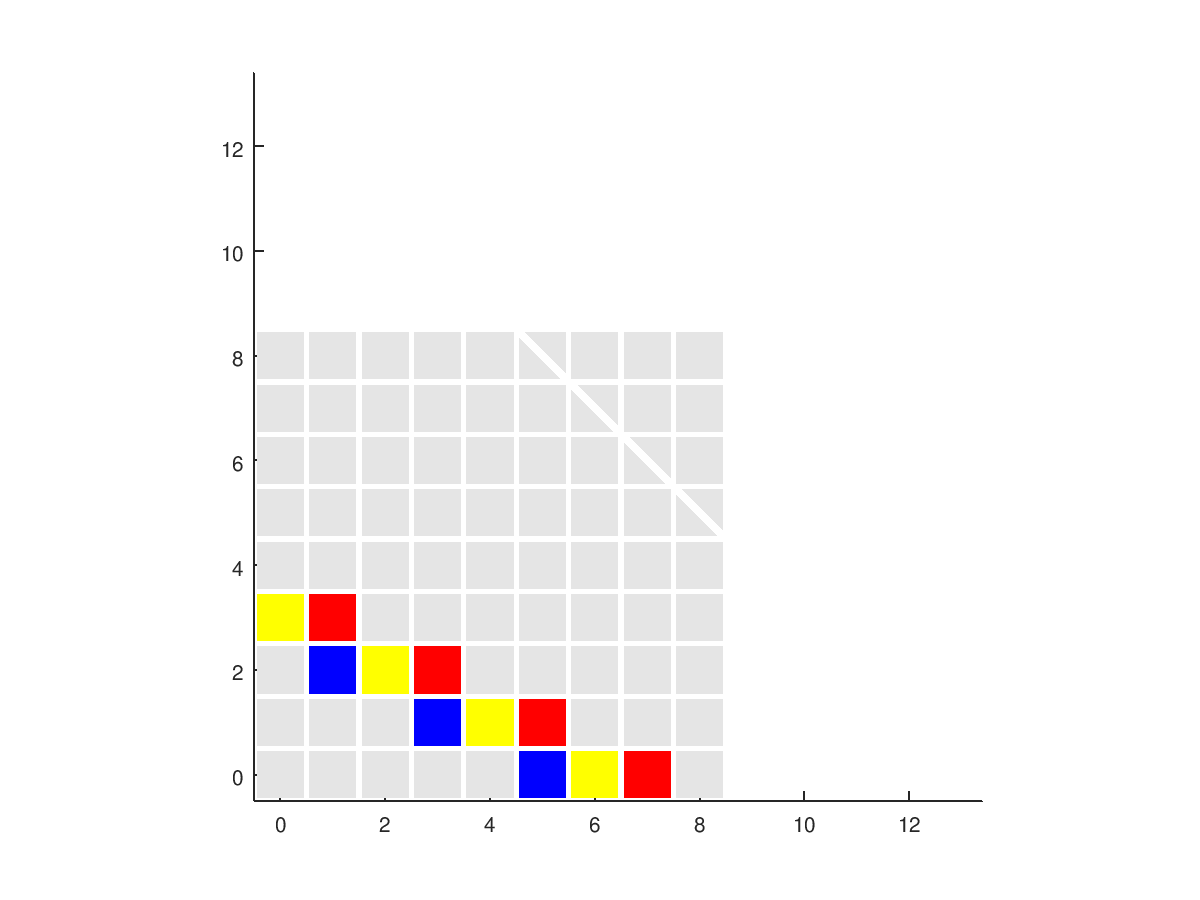
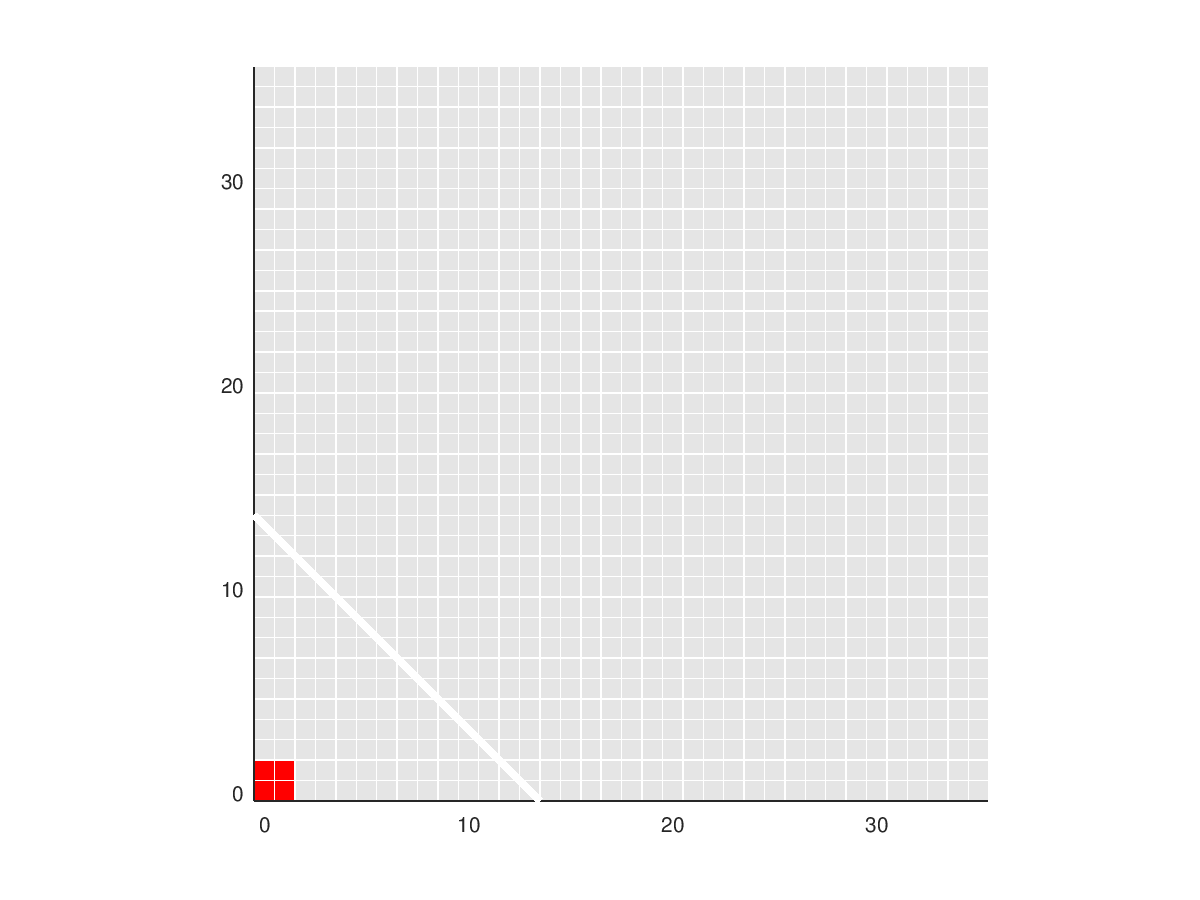
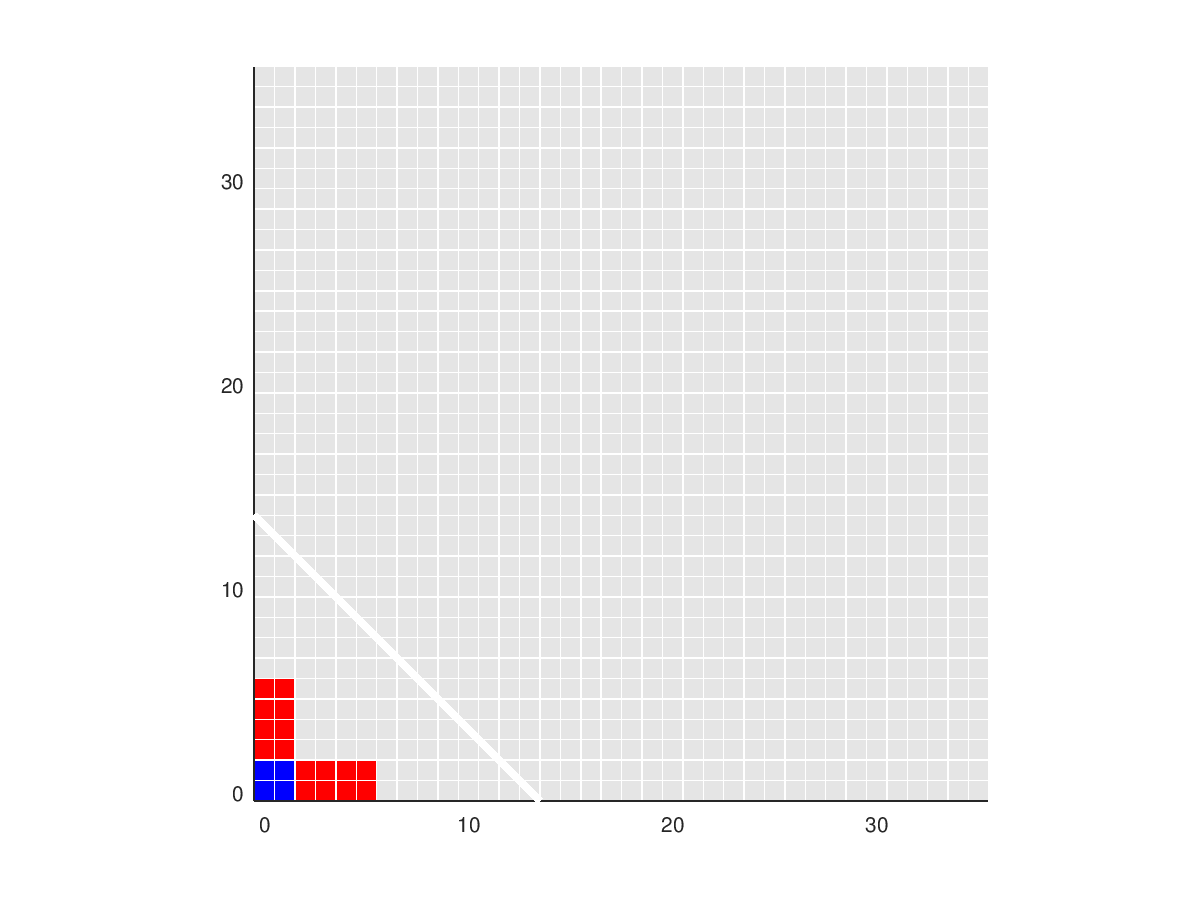
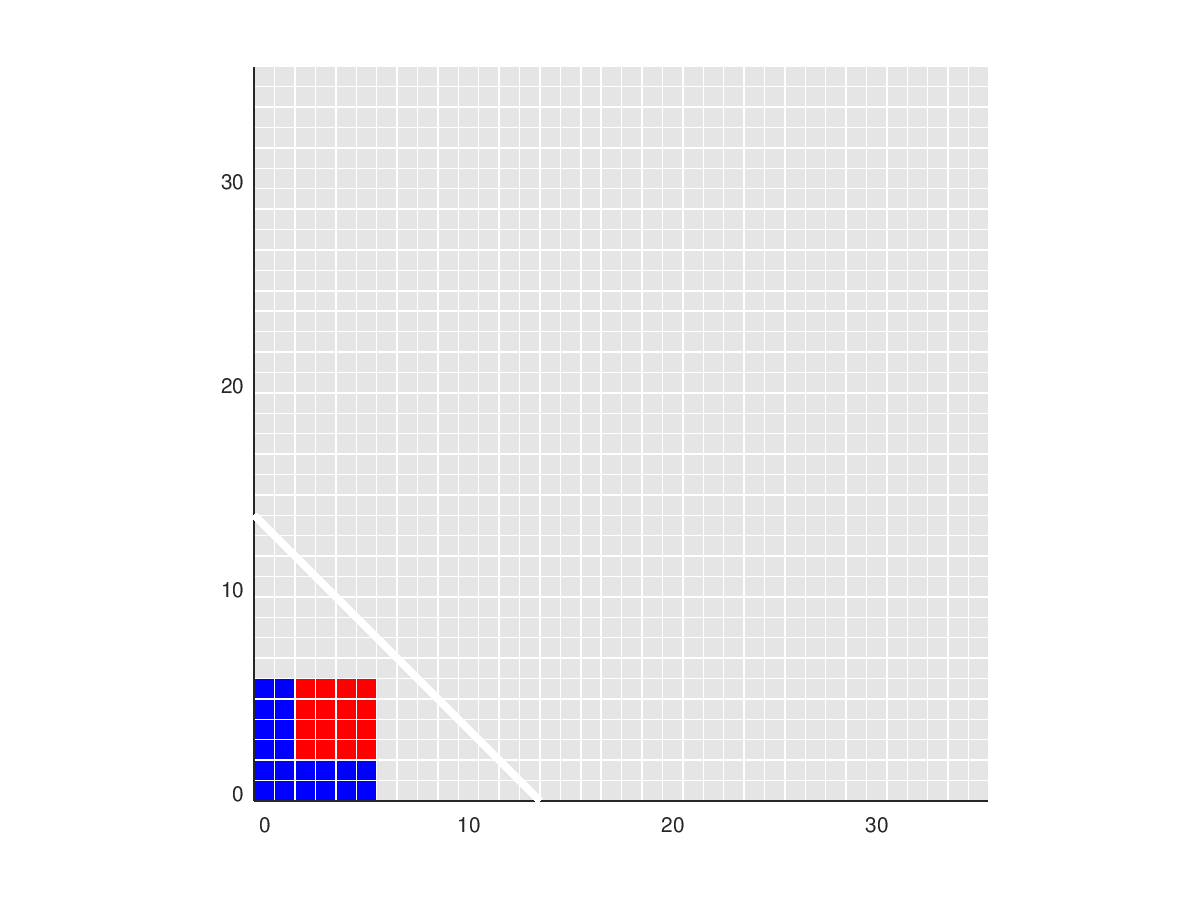
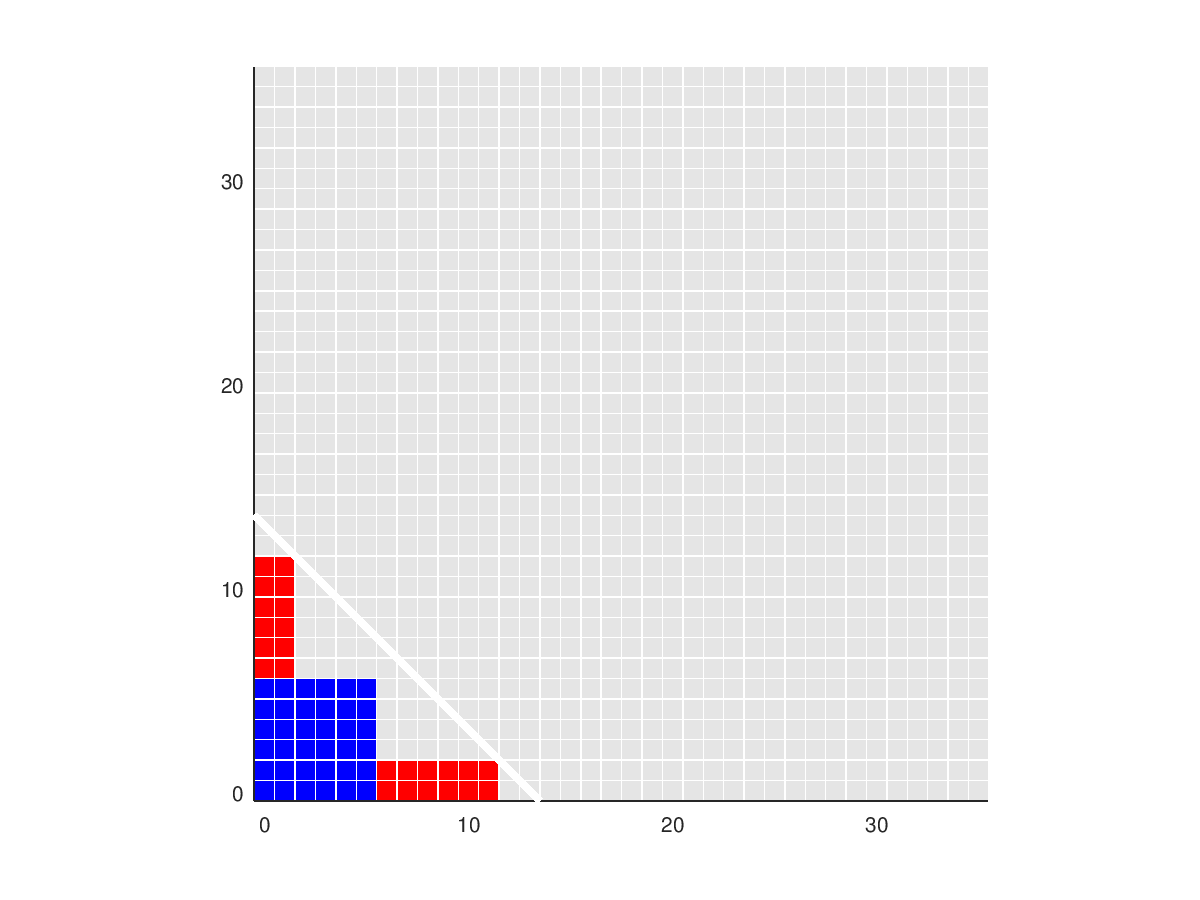
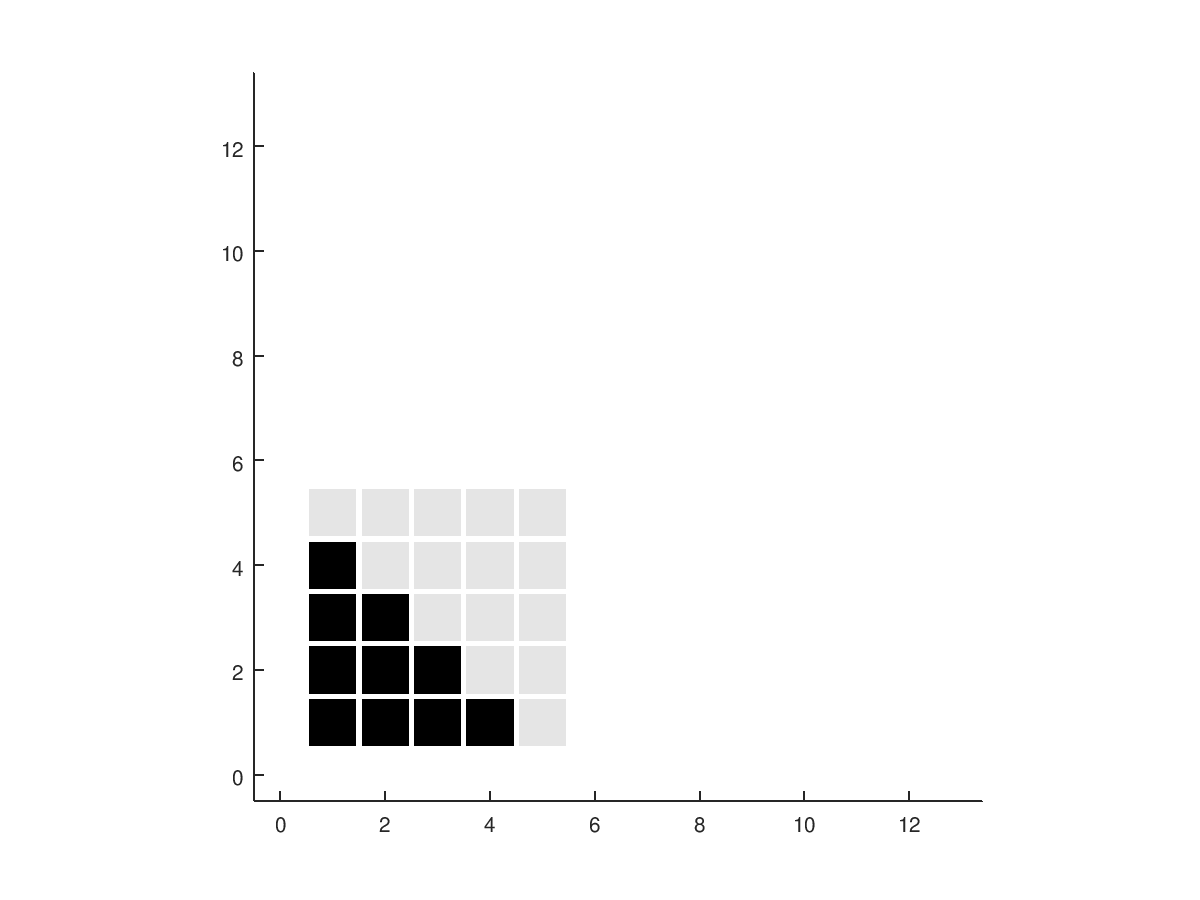
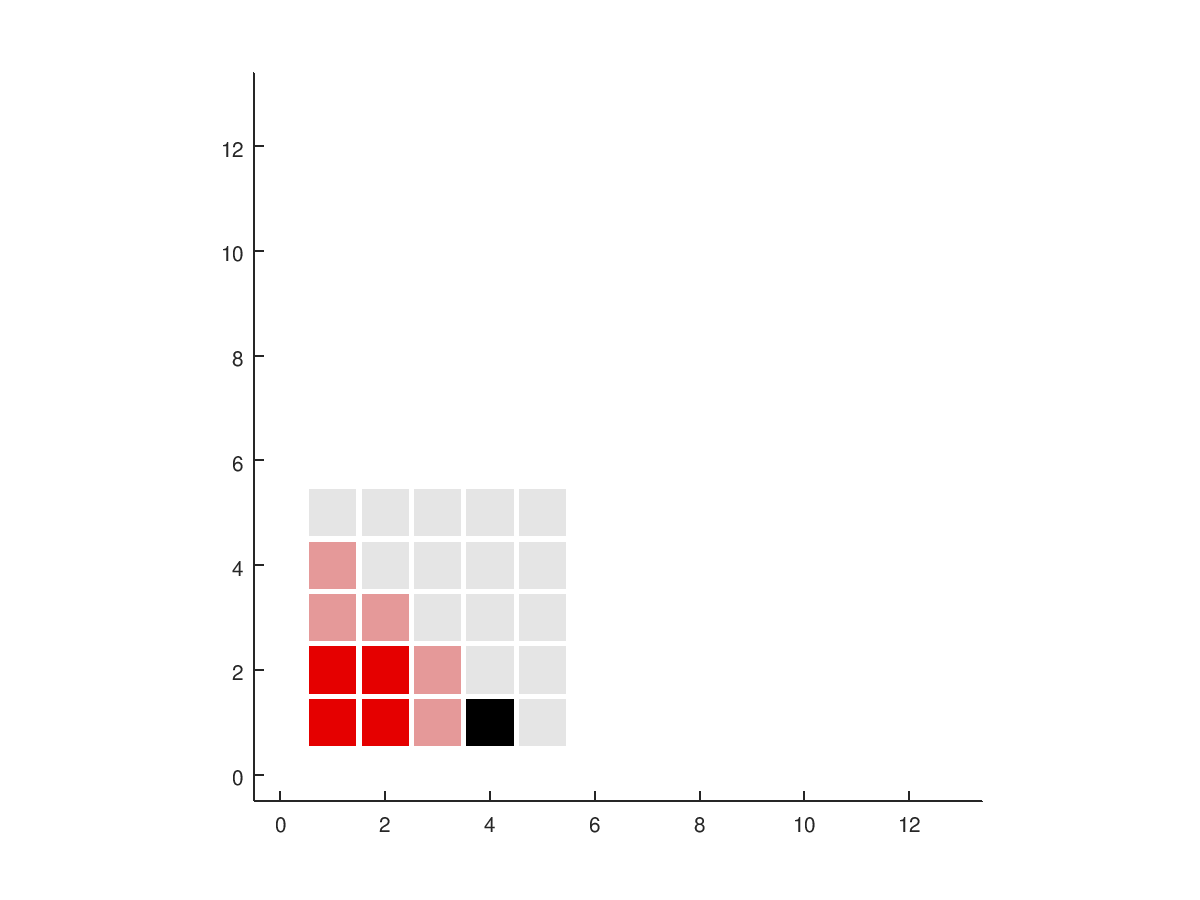
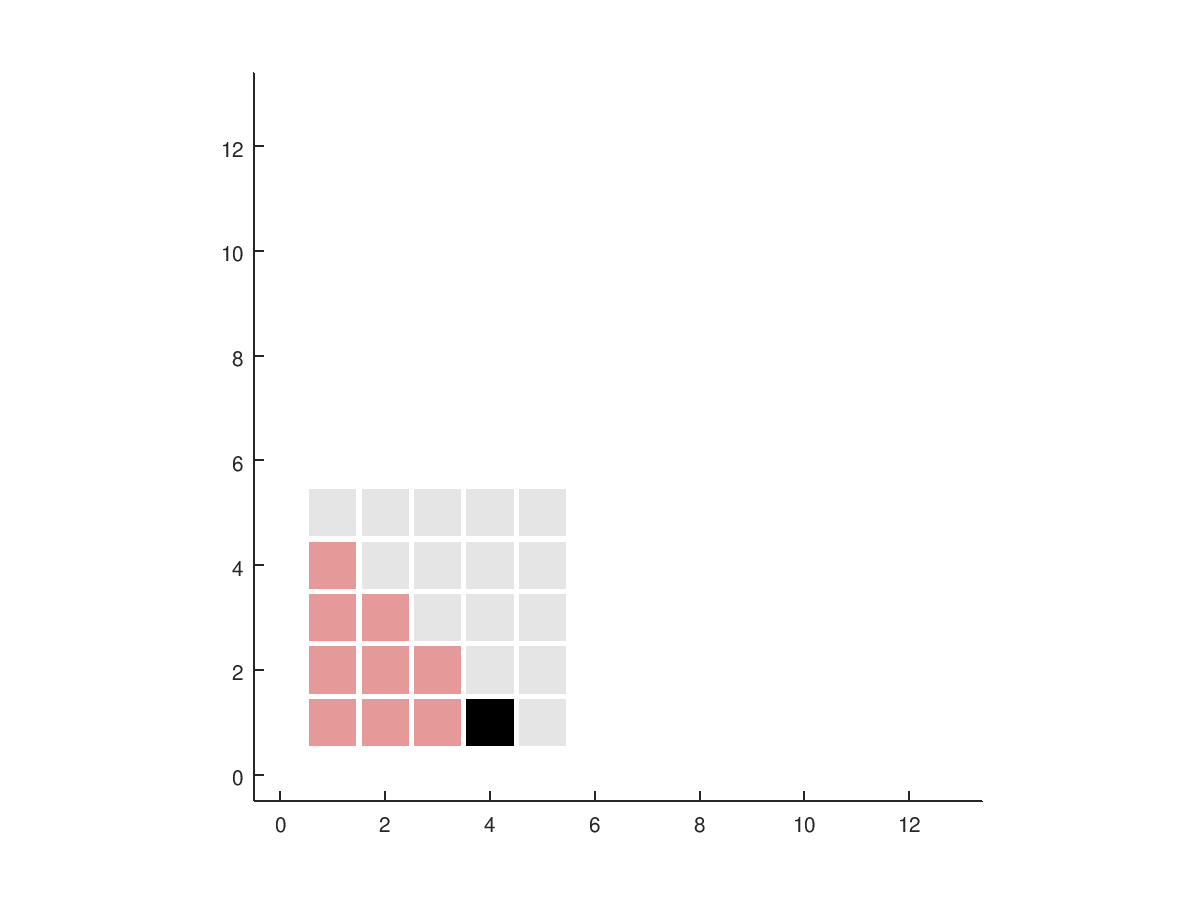
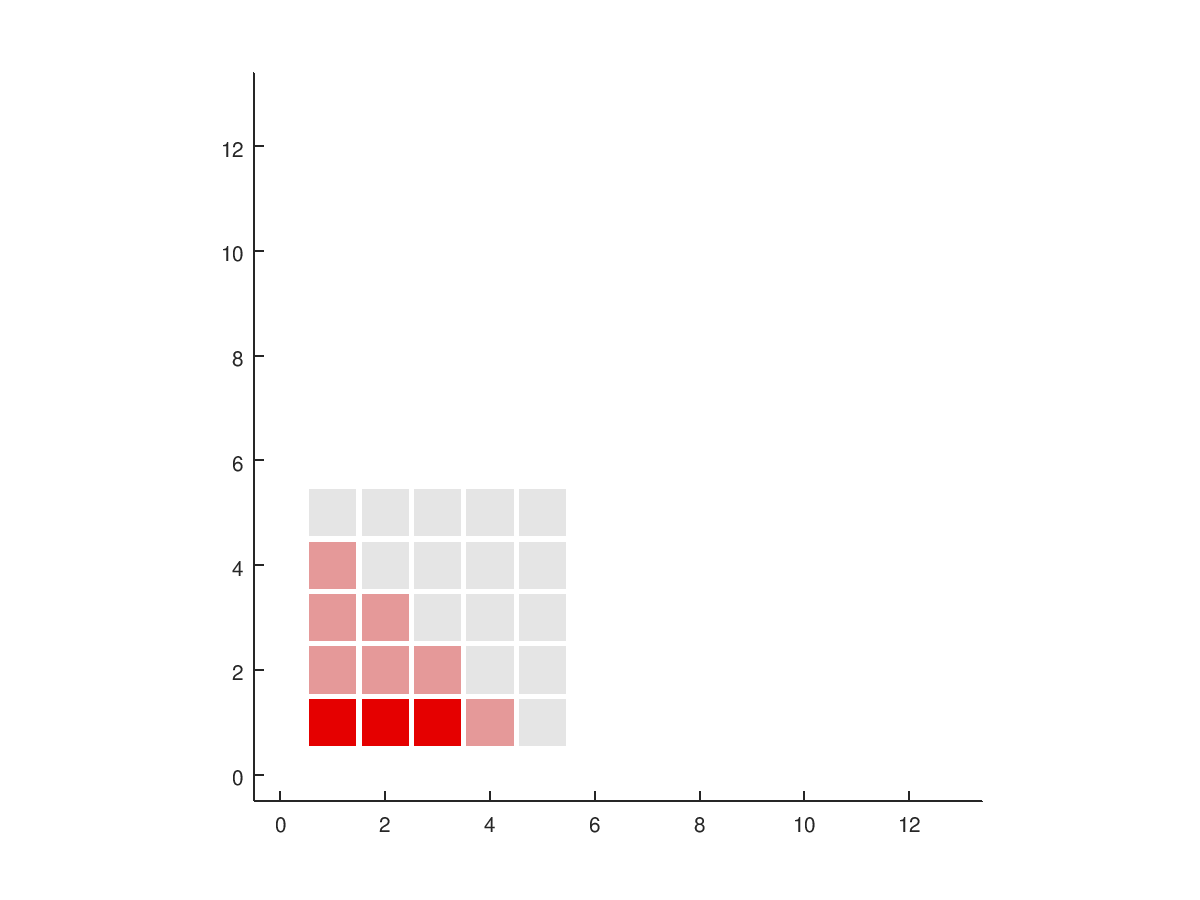
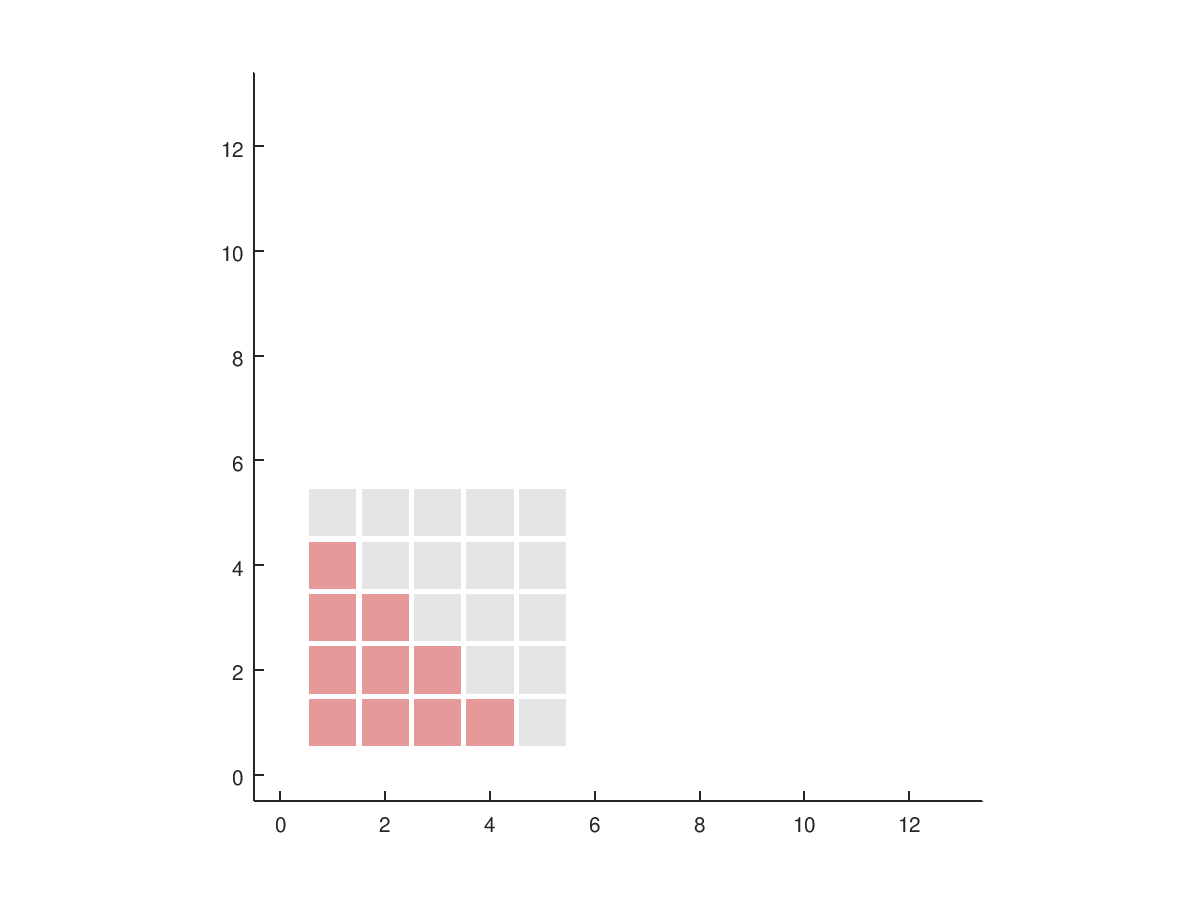
ADAPTIVE looks at the adaptive modification of a sparse grid
rule in 2D.
-
adaptive_1.txt,
the coordinates and colors.
-
adaptive_1.png,
-
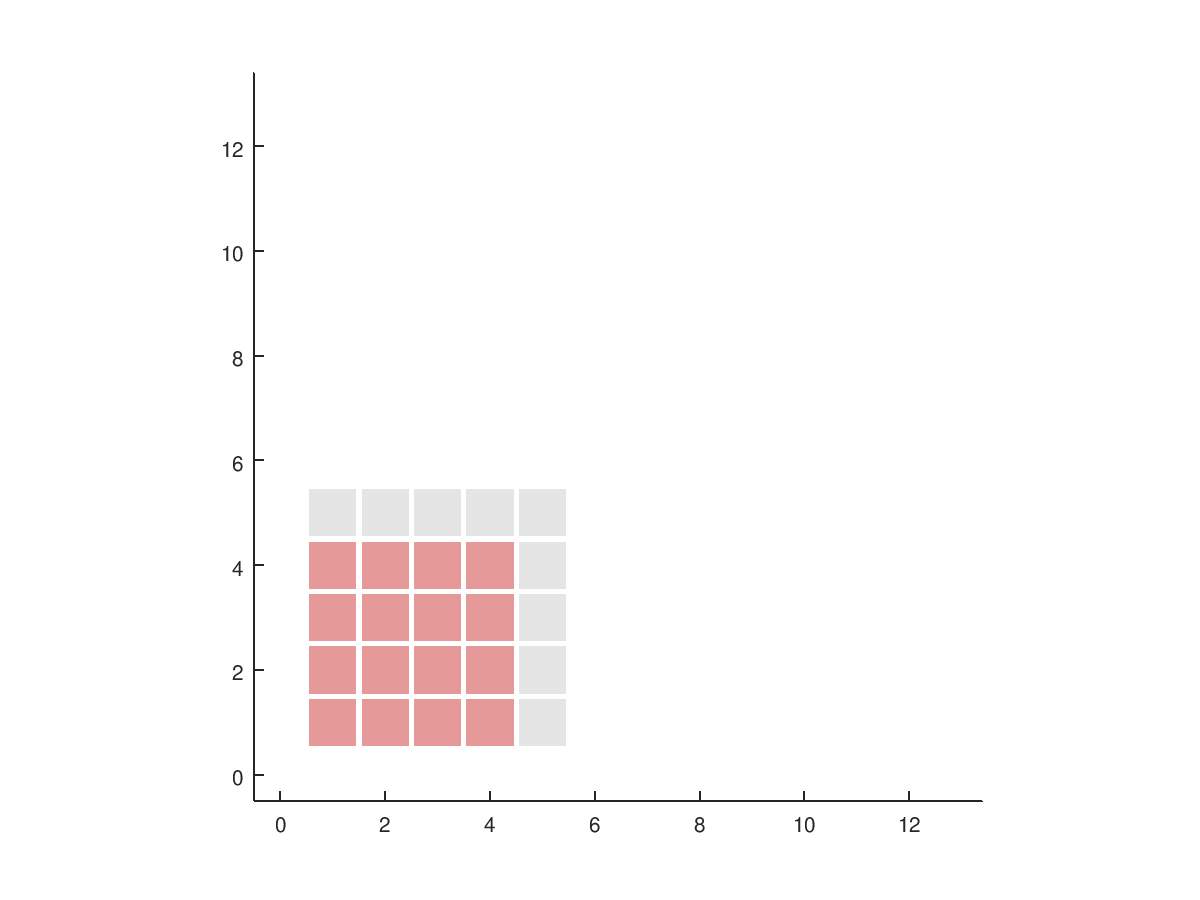
adaptive_2.txt,
the coordinates and colors.
-
adaptive_2.png,
-
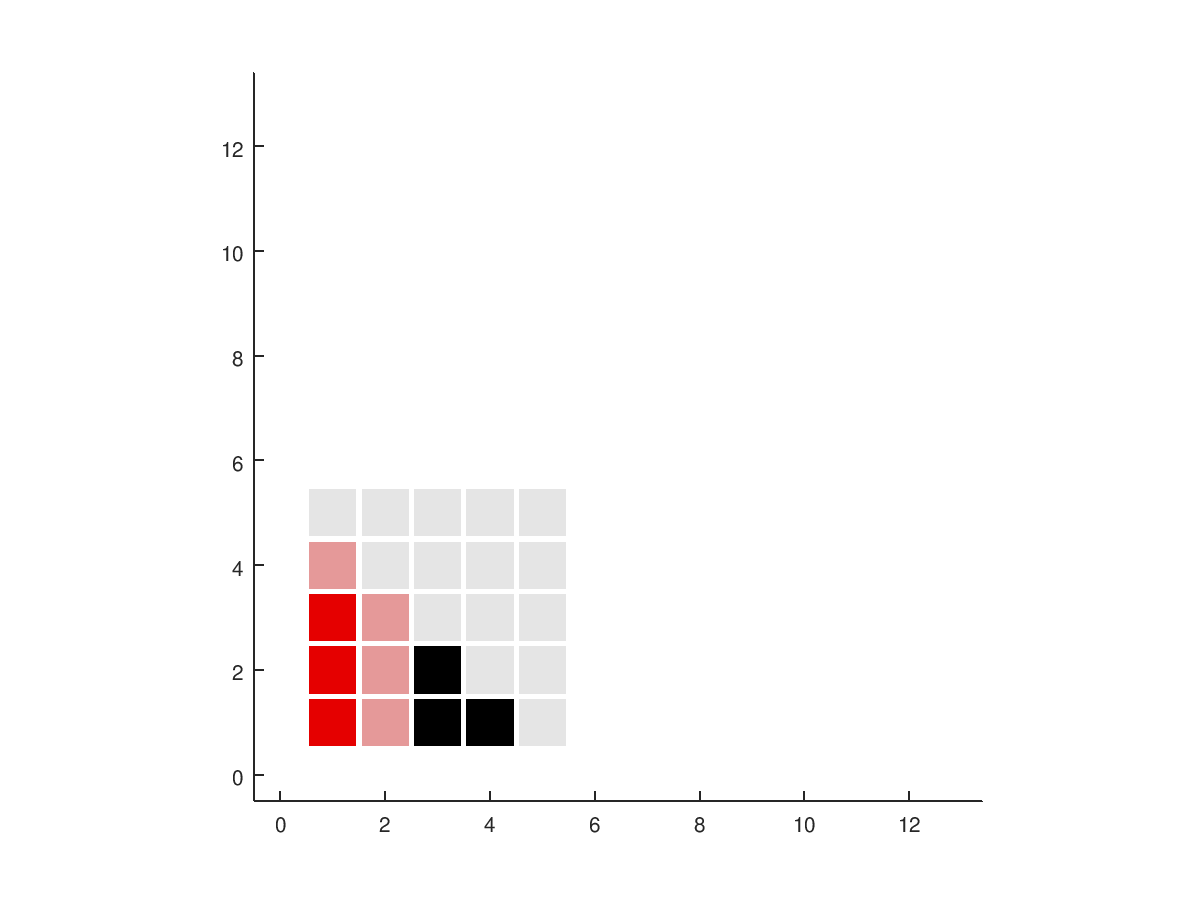
adaptive_3.txt,
the coordinates and colors.
-
adaptive_3.png,
-
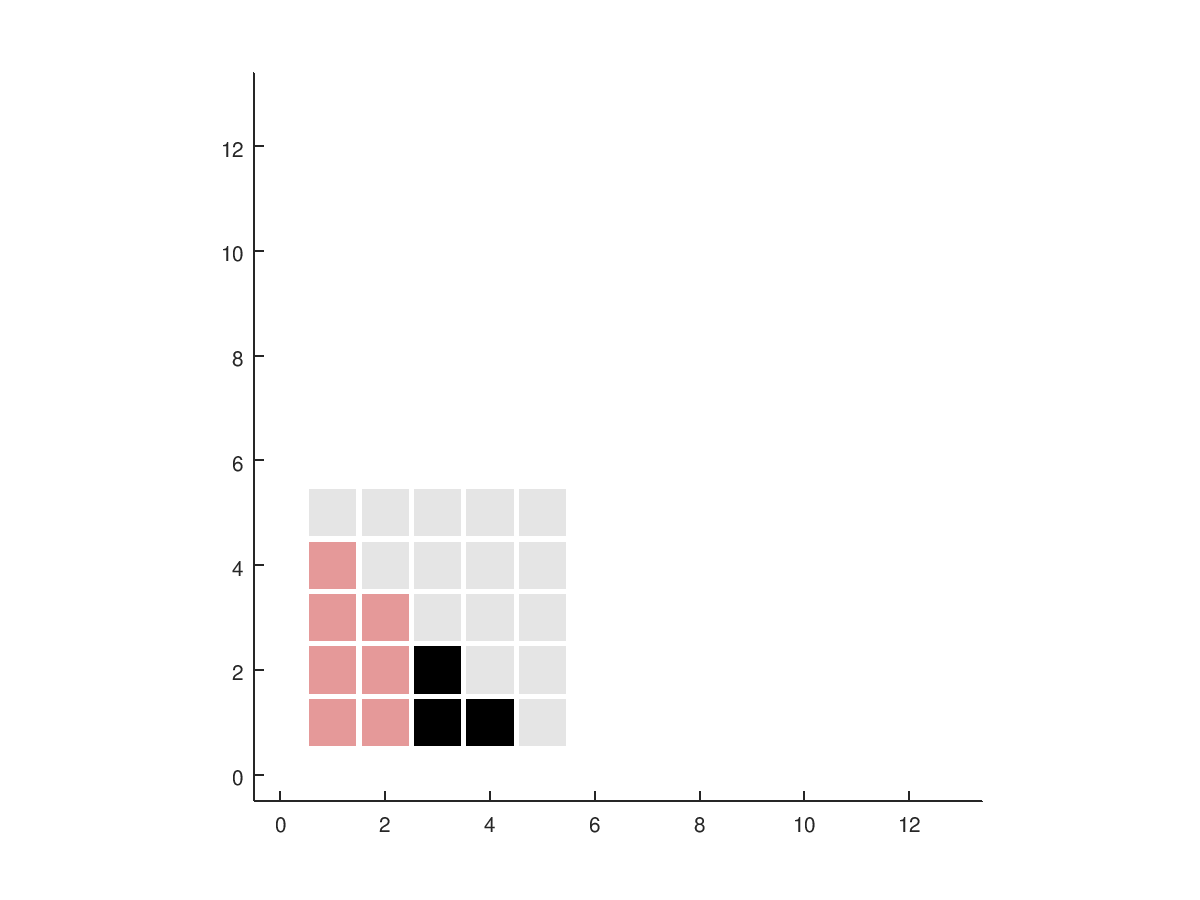
adaptive_4.txt,
the coordinates and colors.
-
adaptive_4.png,
-
adaptive_5.txt,
the coordinates and colors.
-
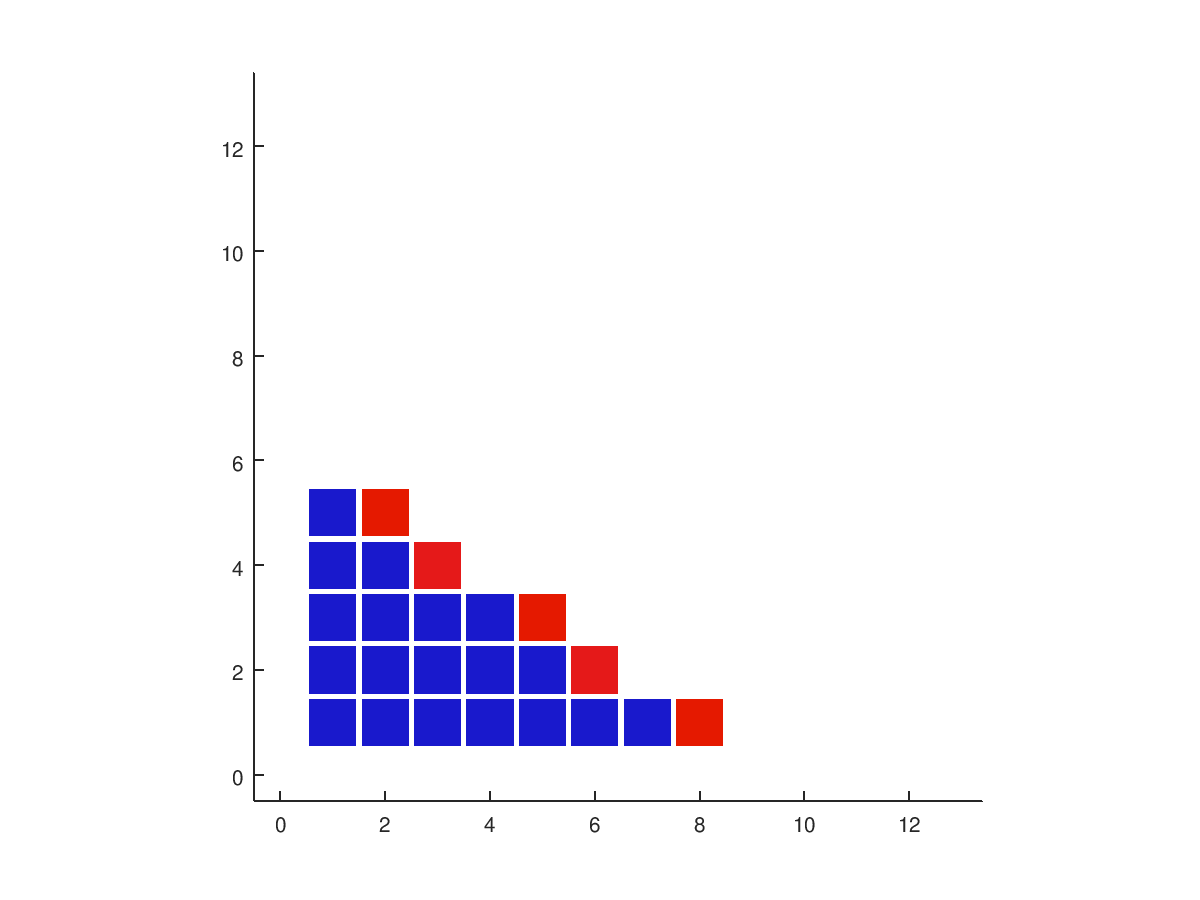
adaptive_5.png,
-
abc.png,
steps 1 through 3 in one plot.
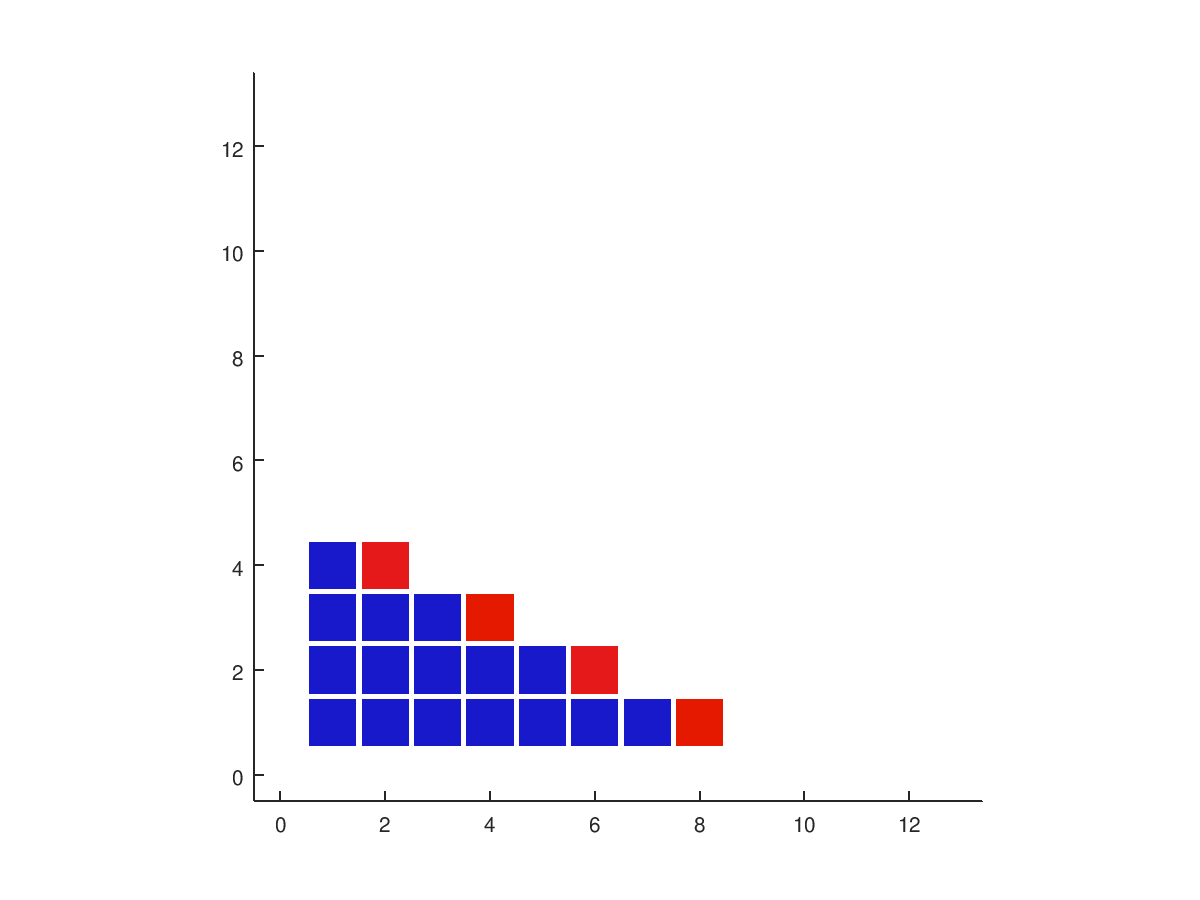
-
de.png,
steps 4 through 5 in one plot.
-
abcde.png,
steps 1 through 5 in one plot.
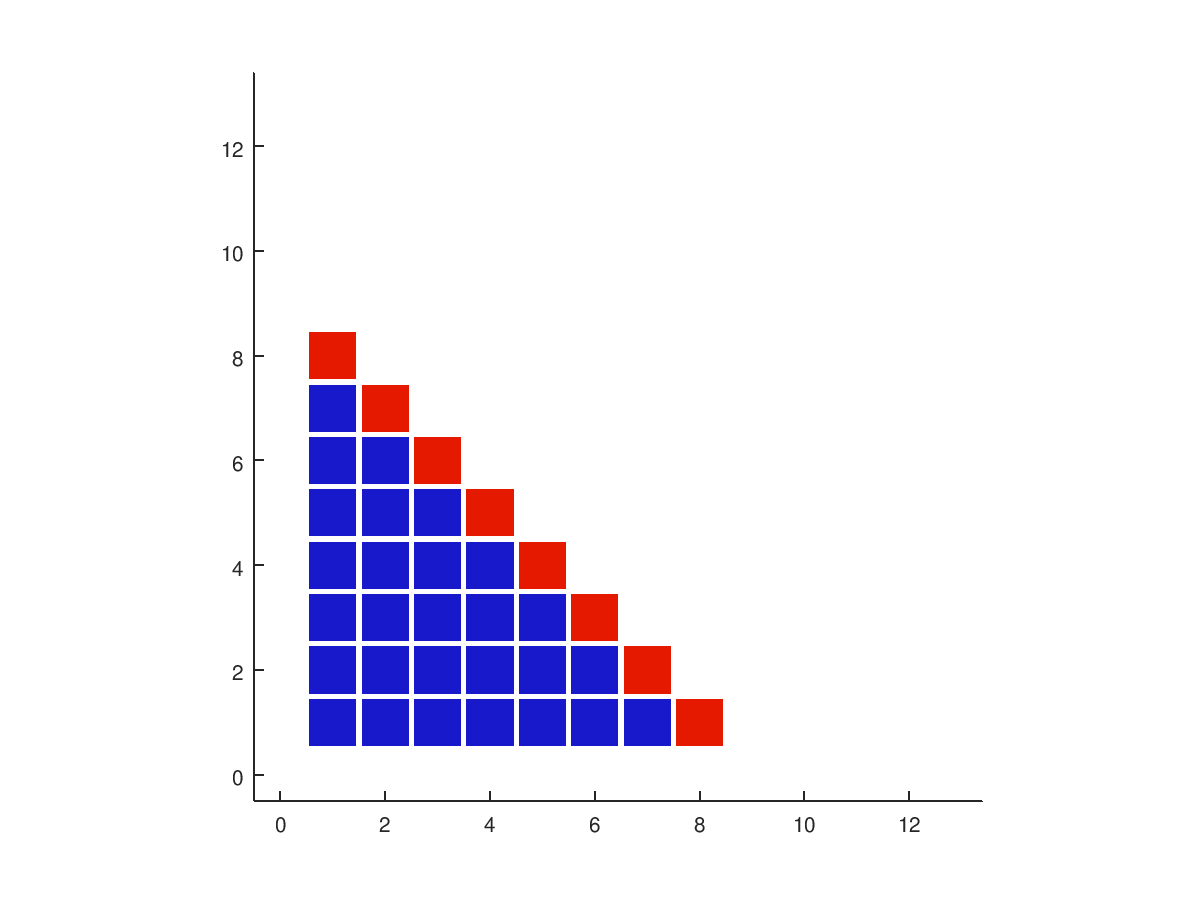
ALPHA_1.0_1.0 prints some of the 64 pairs of values
on an 8 by 8 grid. Blue indicates "old" data, and red "new".
ALPHA_1.0_1.5 prints some of the 64 pairs of values
on an 8 by 8 grid. Blue indicates "old" data, and red "new".
ALPHA_1.0_2.0 prints some of the 64 pairs of values
on an 8 by 8 grid. Blue indicates "old" data, and red "new".
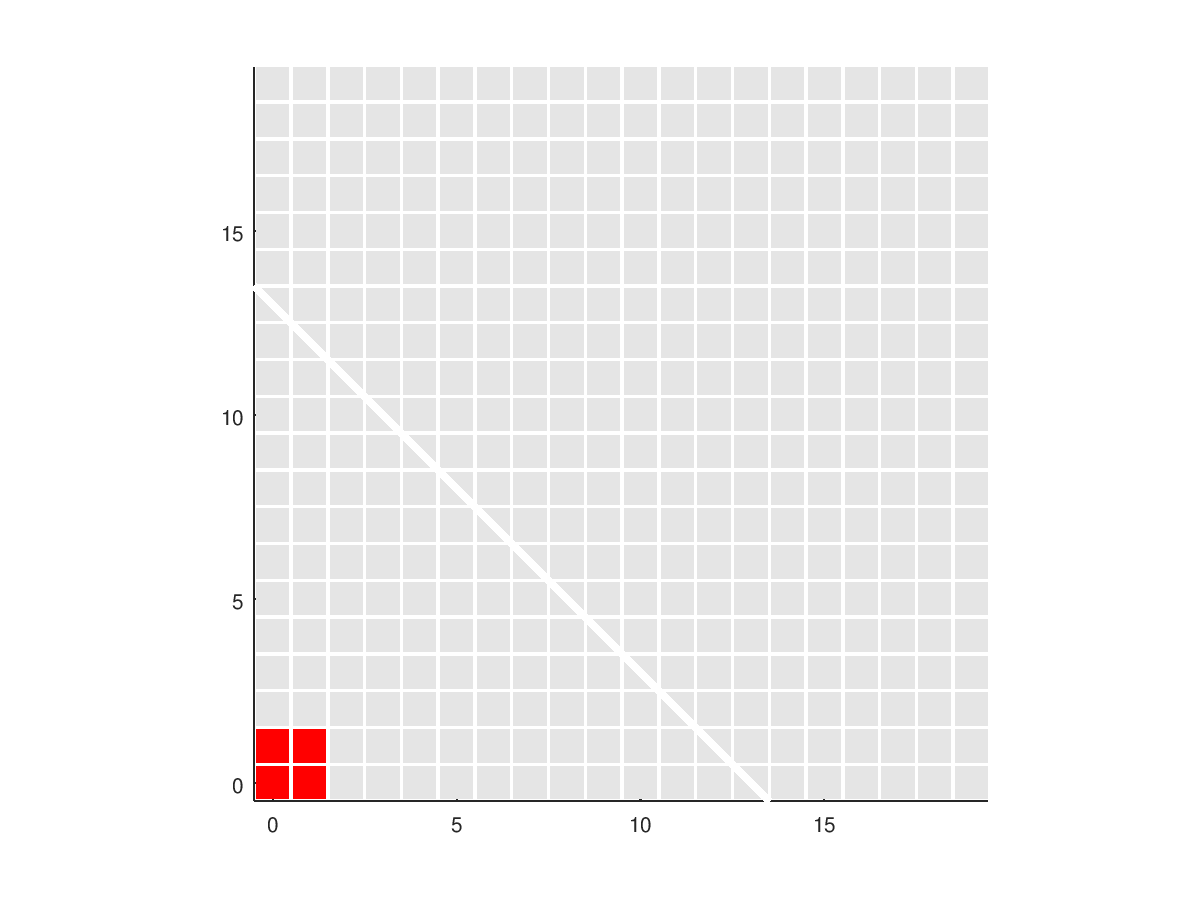
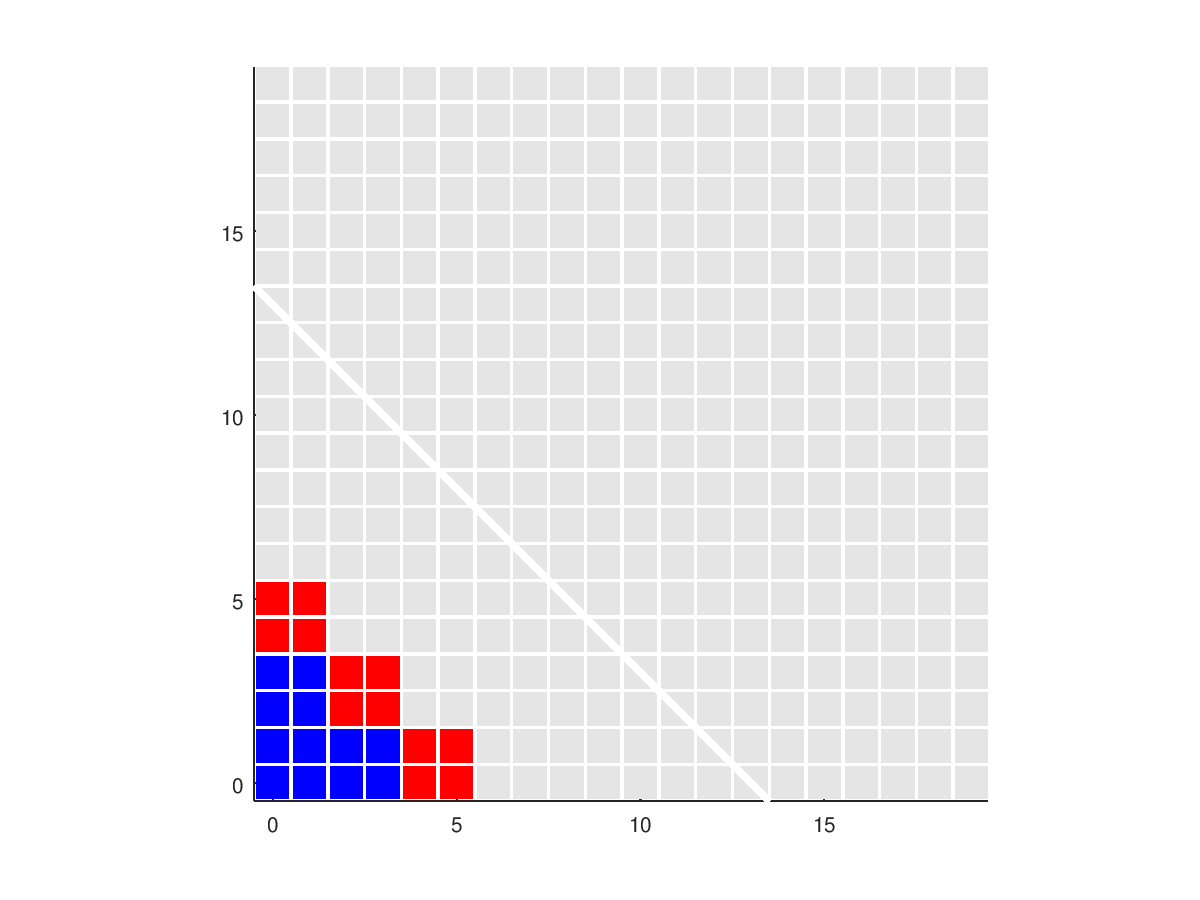
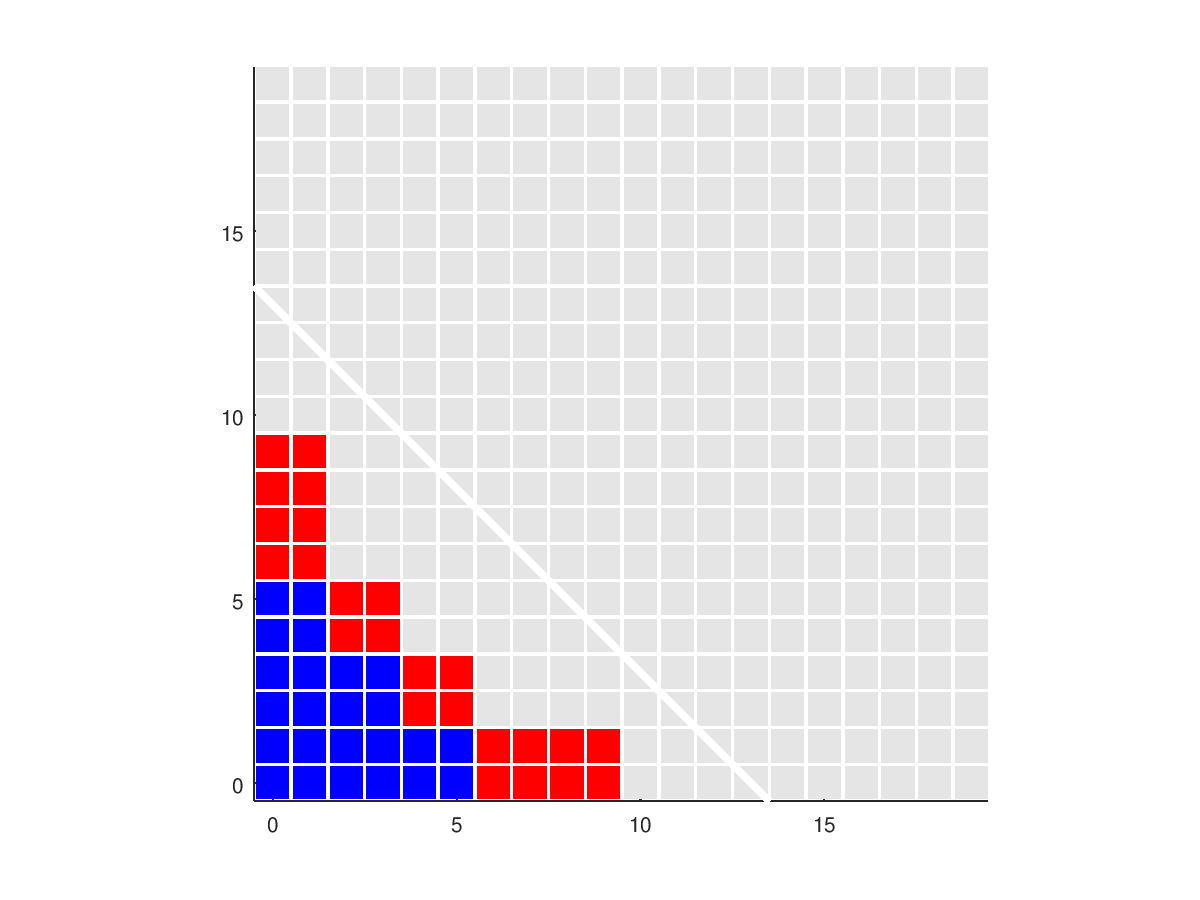
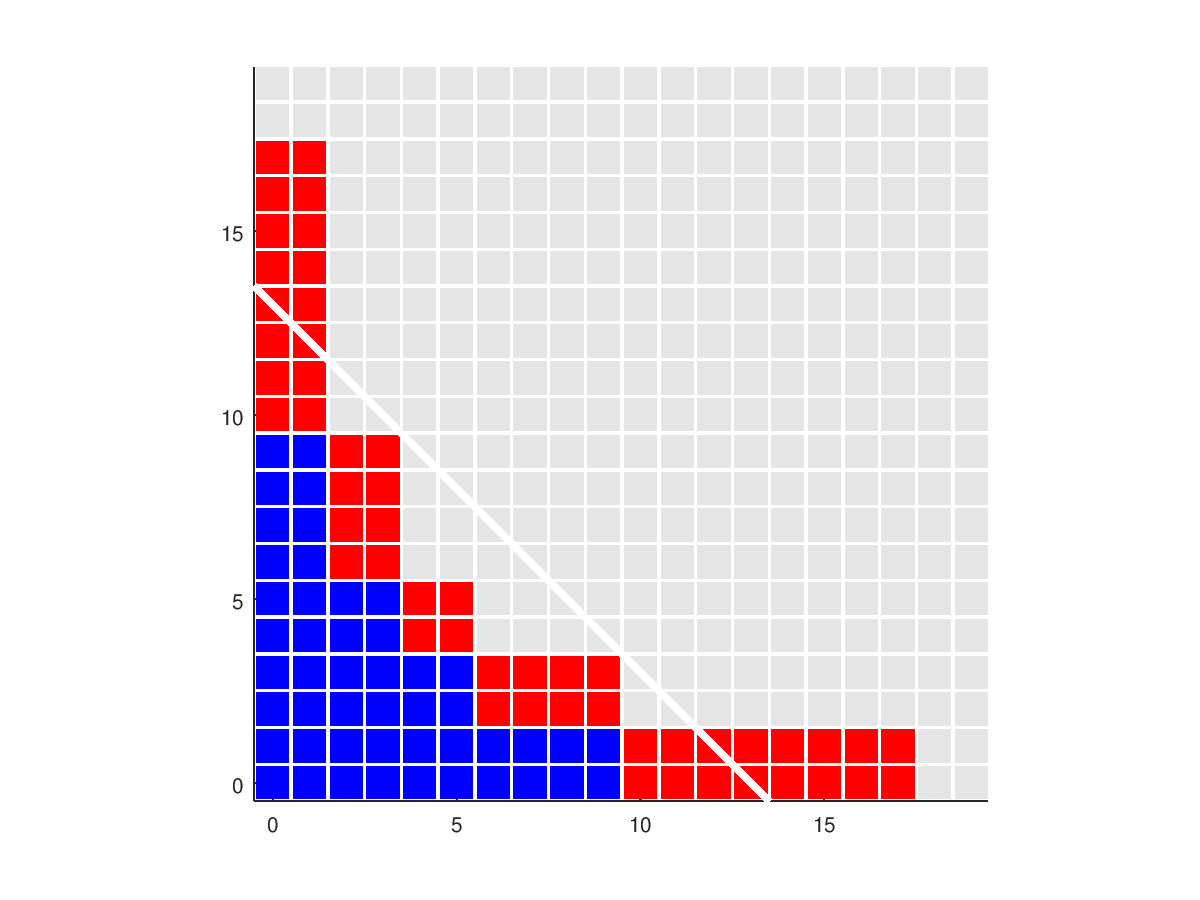
BOXES suggests the monomials that are exactly integrated
by a 2D Clenshaw-Curtis sparse grid of levels 0 through 4. Monomials
added on this level are red, old ones are blue. A common 20x20 grid
is used for all the plots.
-
boxes_level0.txt,
the coordinates and colors.
-
boxes_level0.png,
a PNG image of a plot of the points.
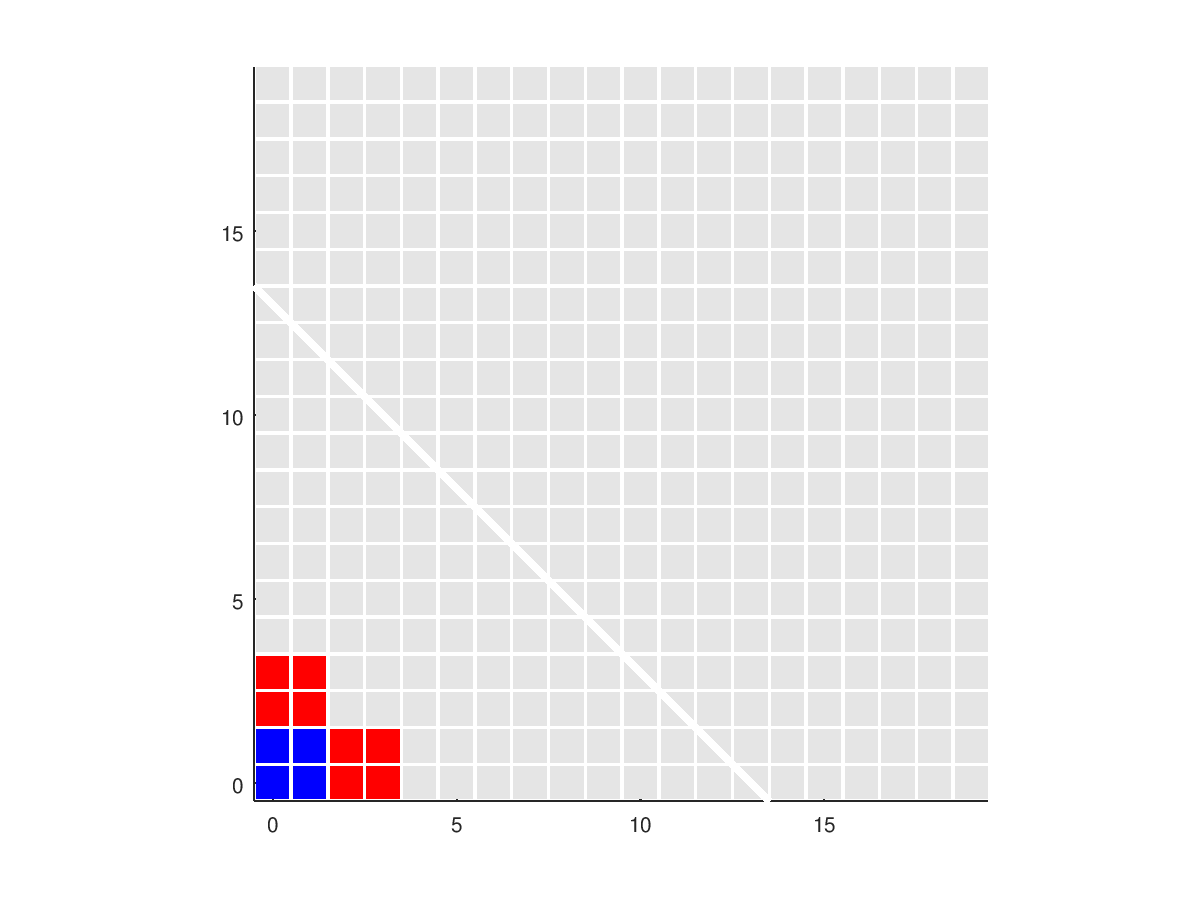
-
boxes_level1.txt,
the coordinates and colors.
-
boxes_level1.png,
a PNG image of a plot of the points.
-
boxes_level2.txt,
the coordinates and colors.
-
boxes_level2.png,
a PNG image of a plot of the points.
-
boxes_level3.txt,
the coordinates and colors.
-
boxes_level3.png,
a PNG image of a plot of the points.
-
boxes_level4.txt,
the coordinates and colors.
-
boxes_level4.png,
a PNG image of a plot of the points.
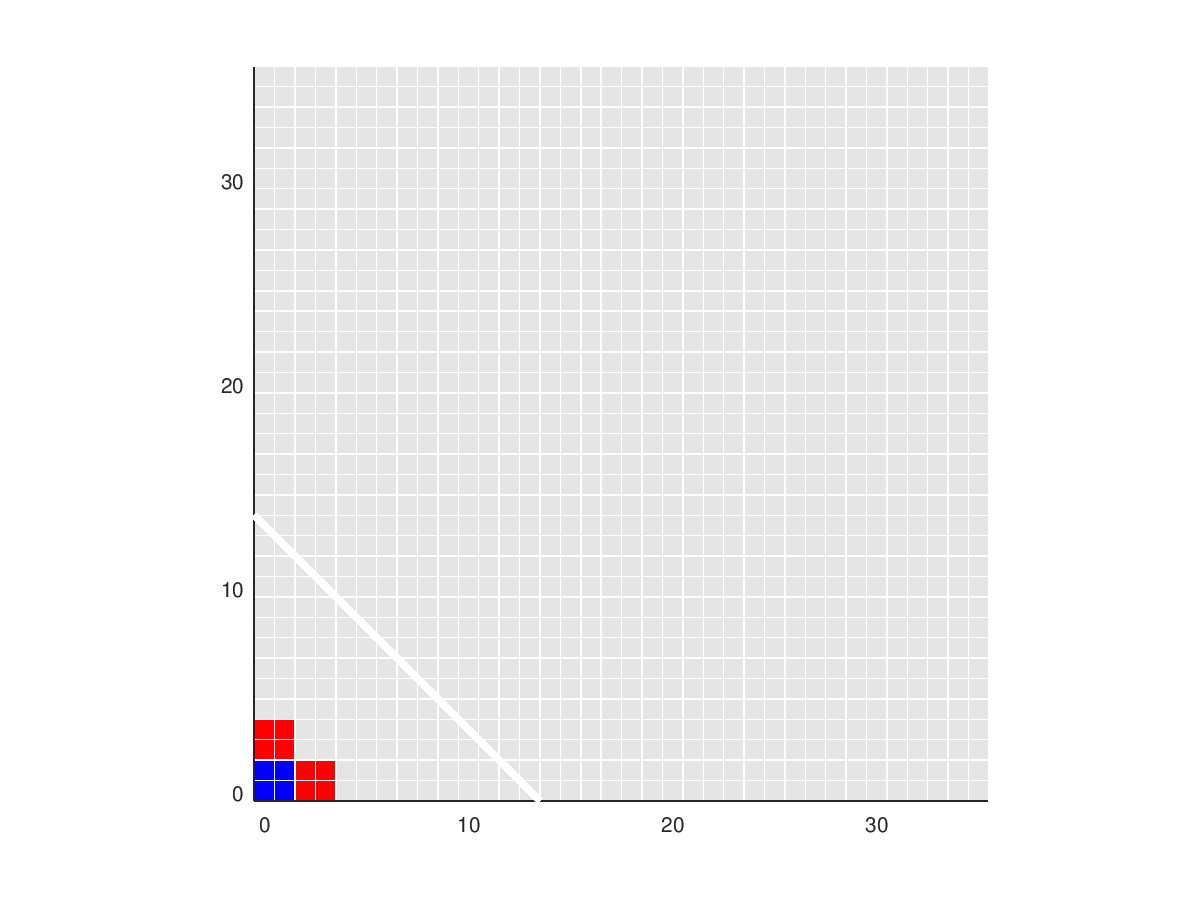
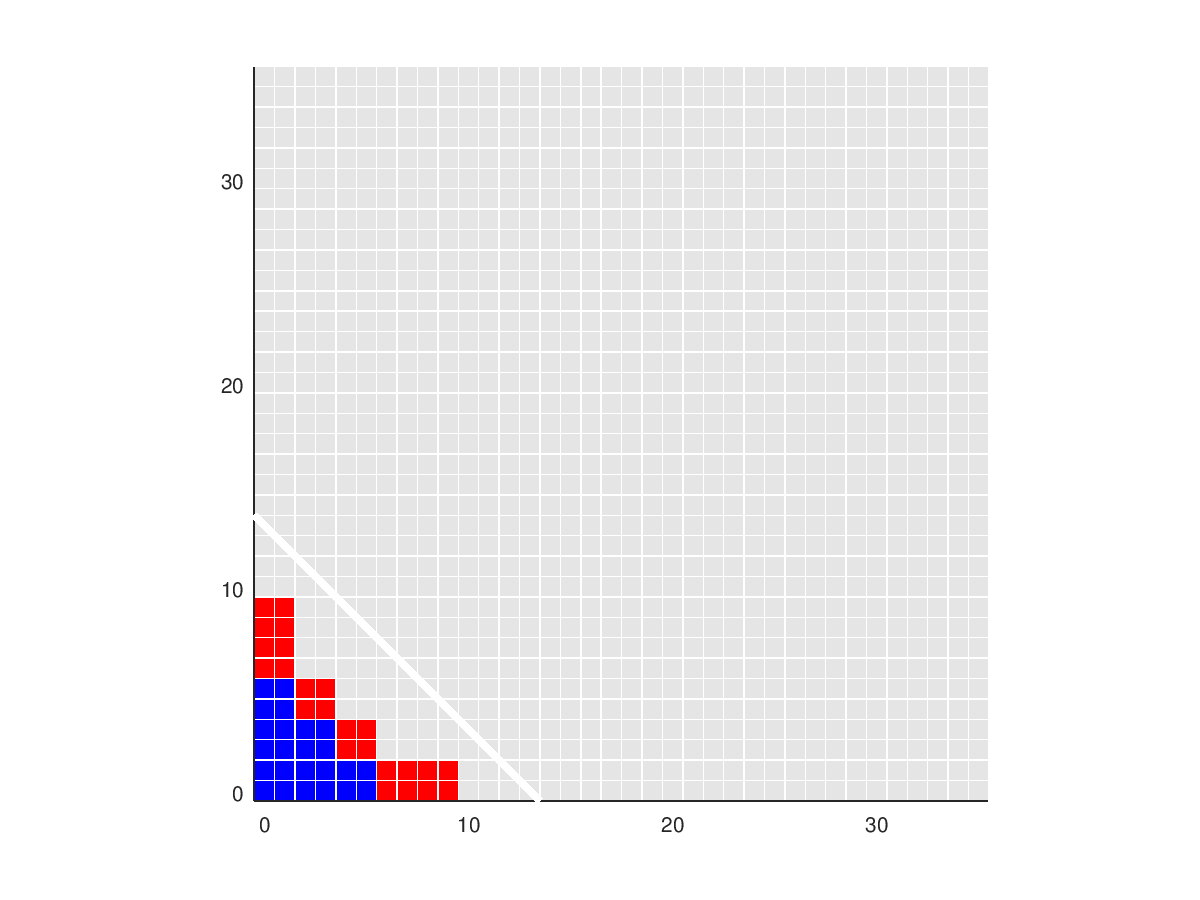
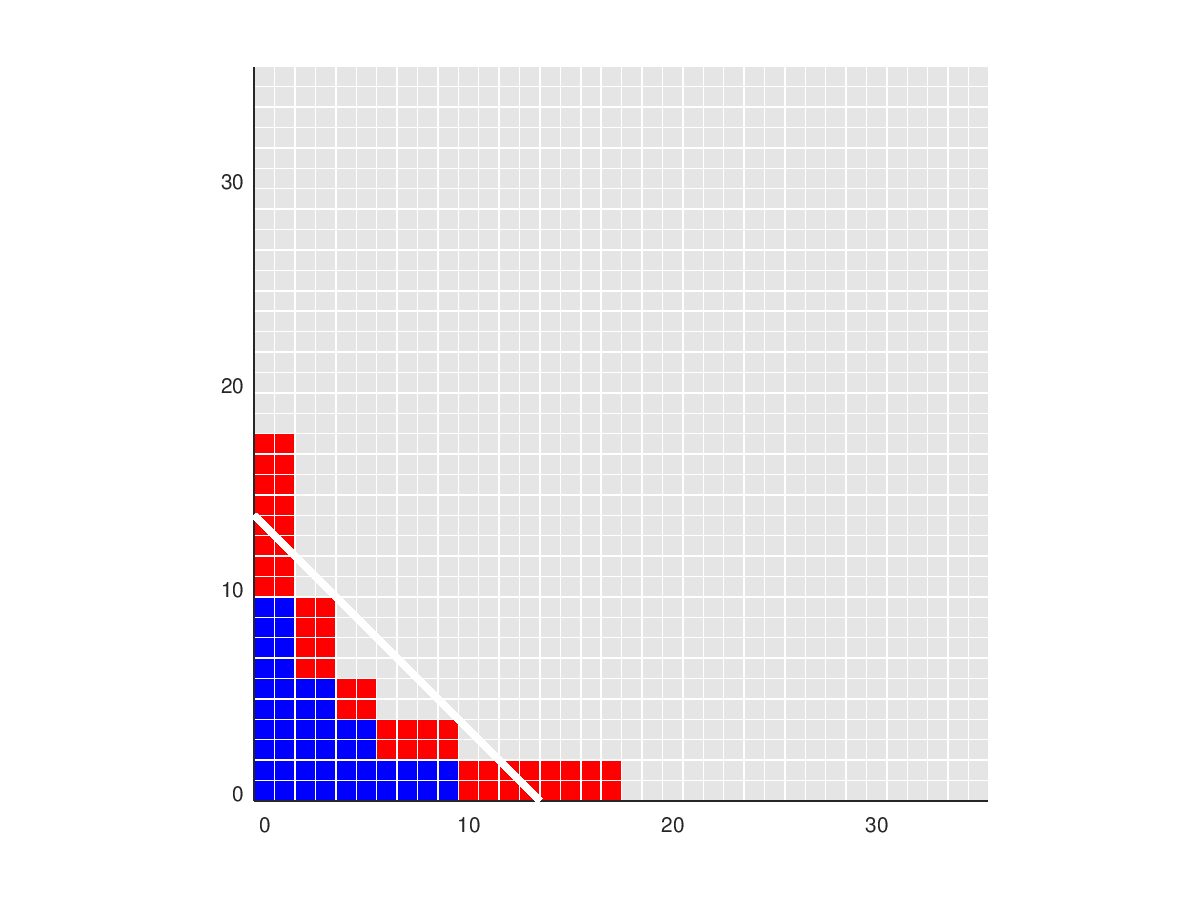
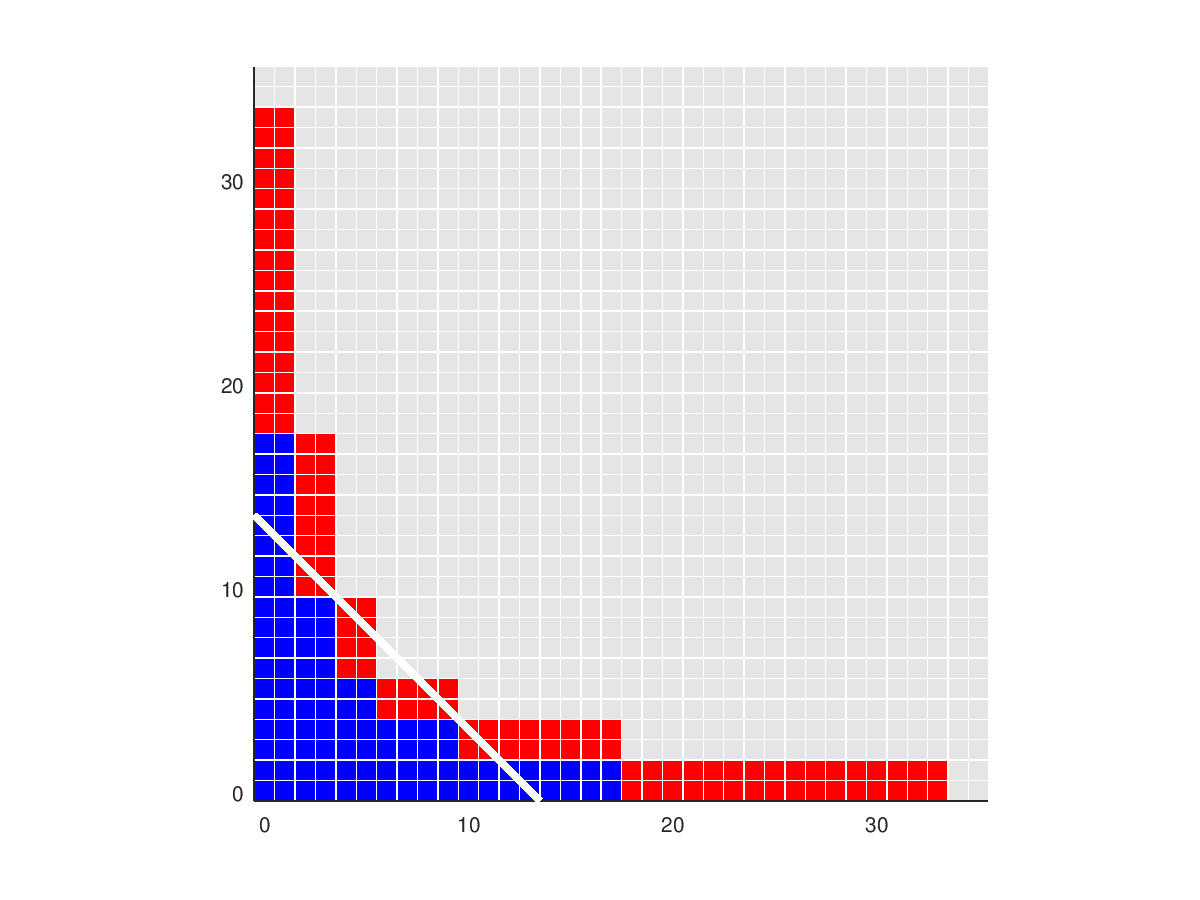
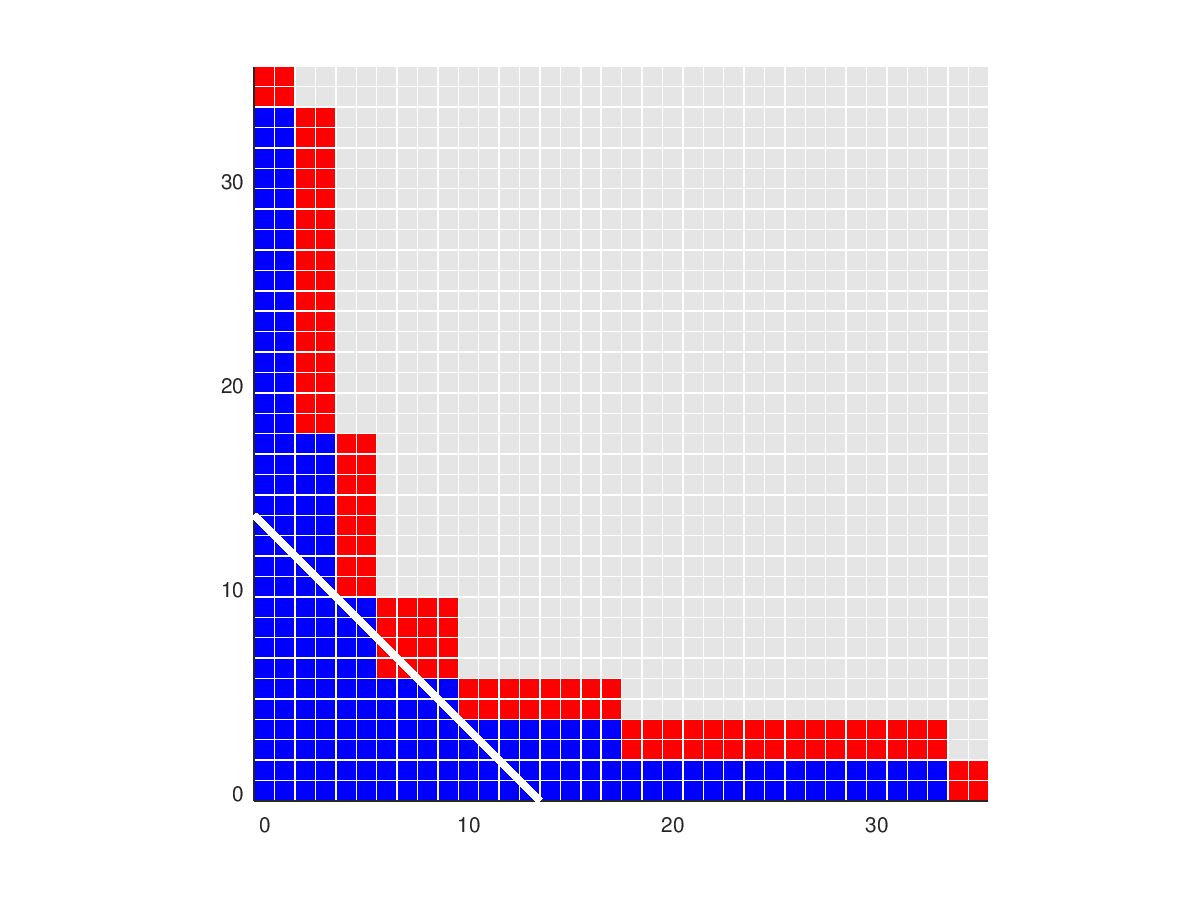
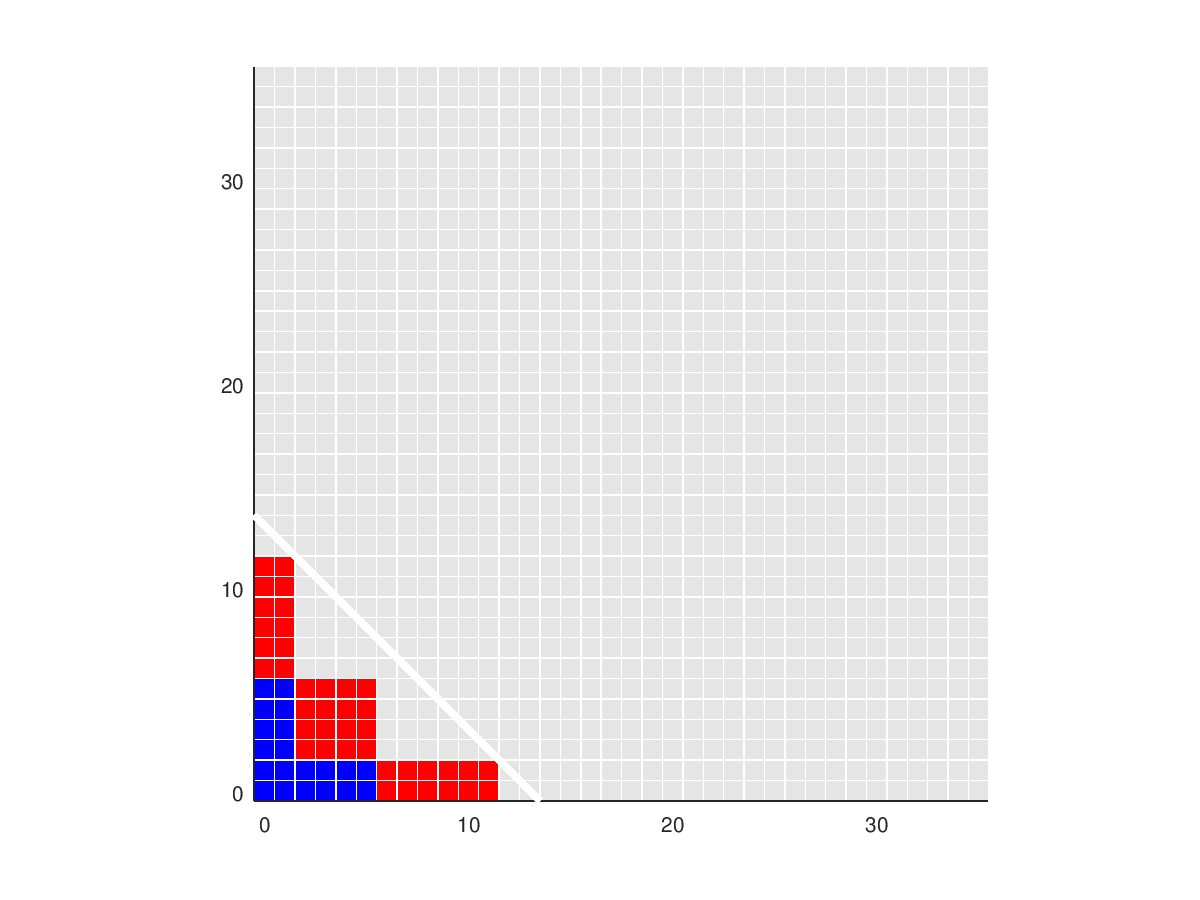
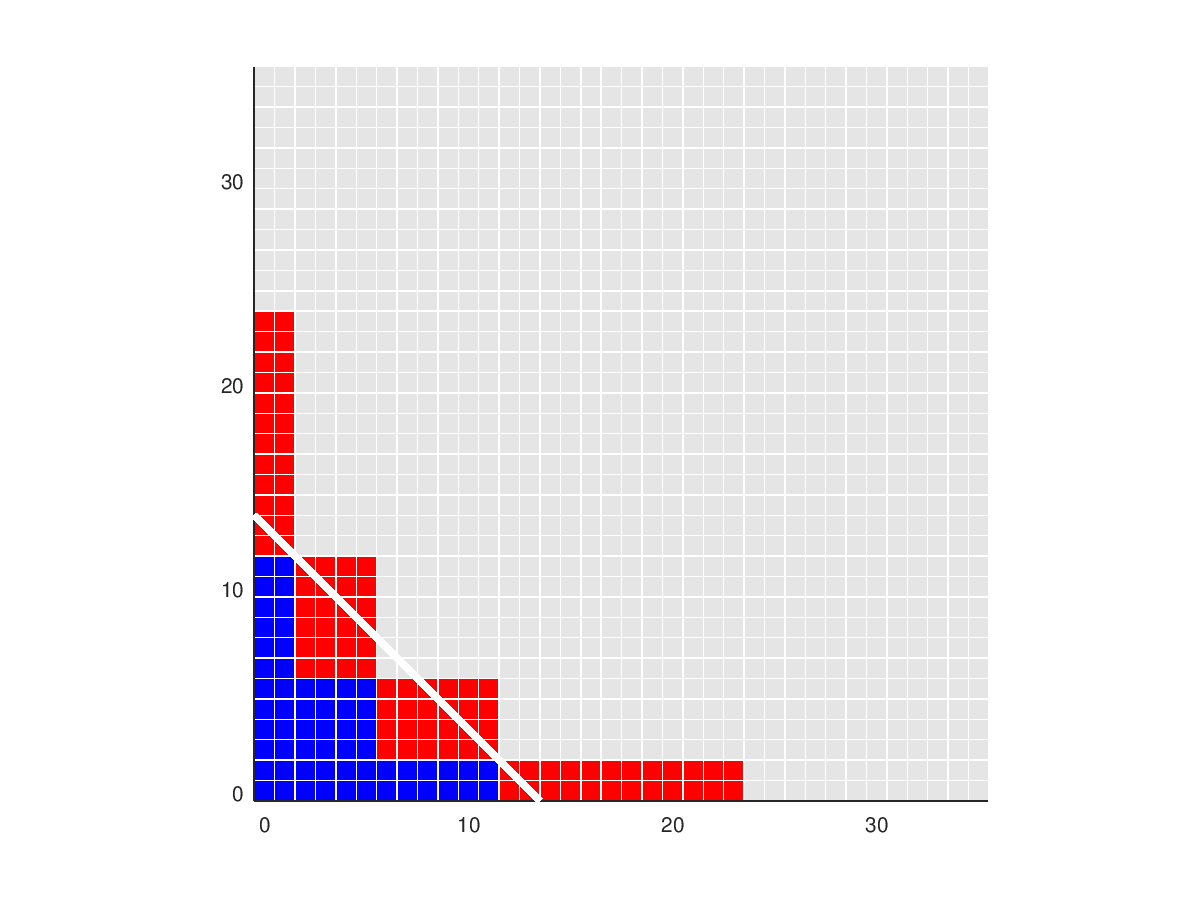
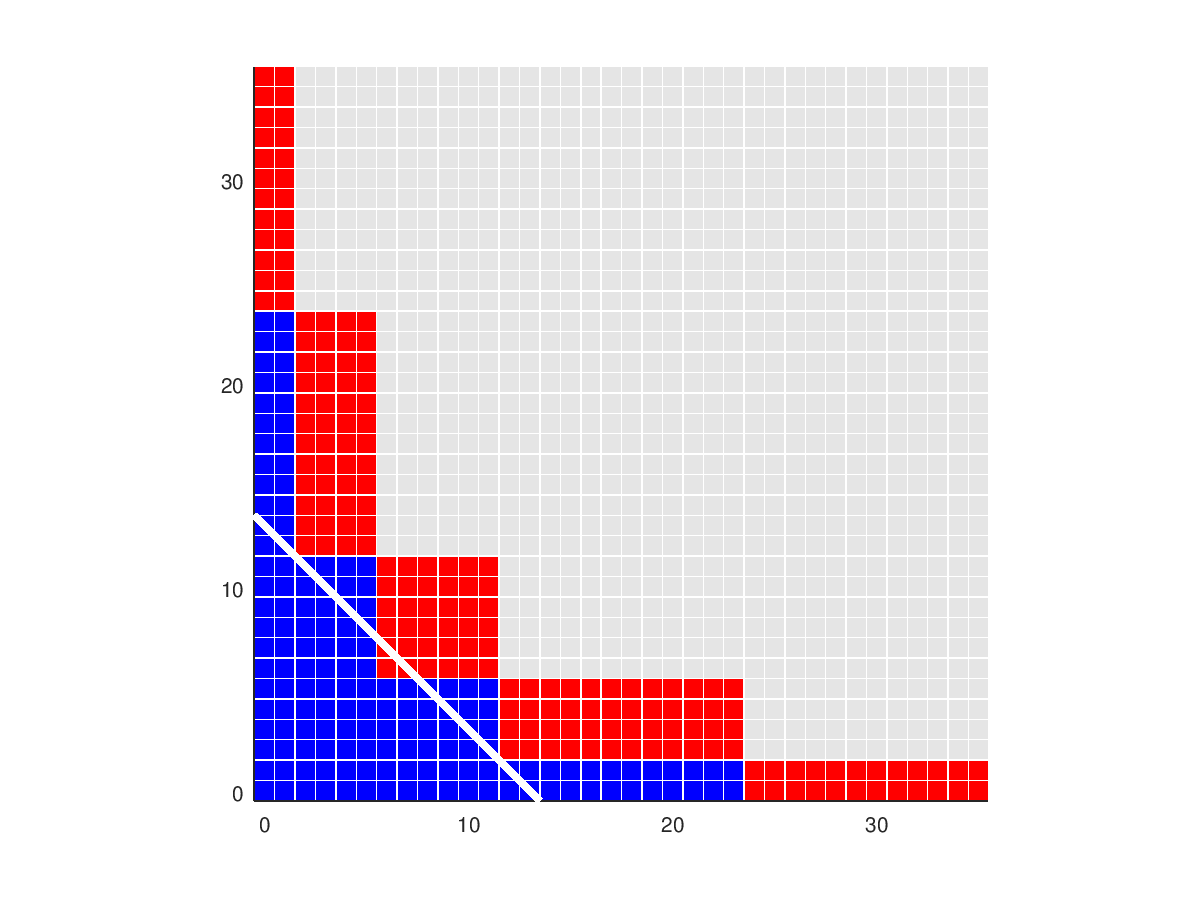
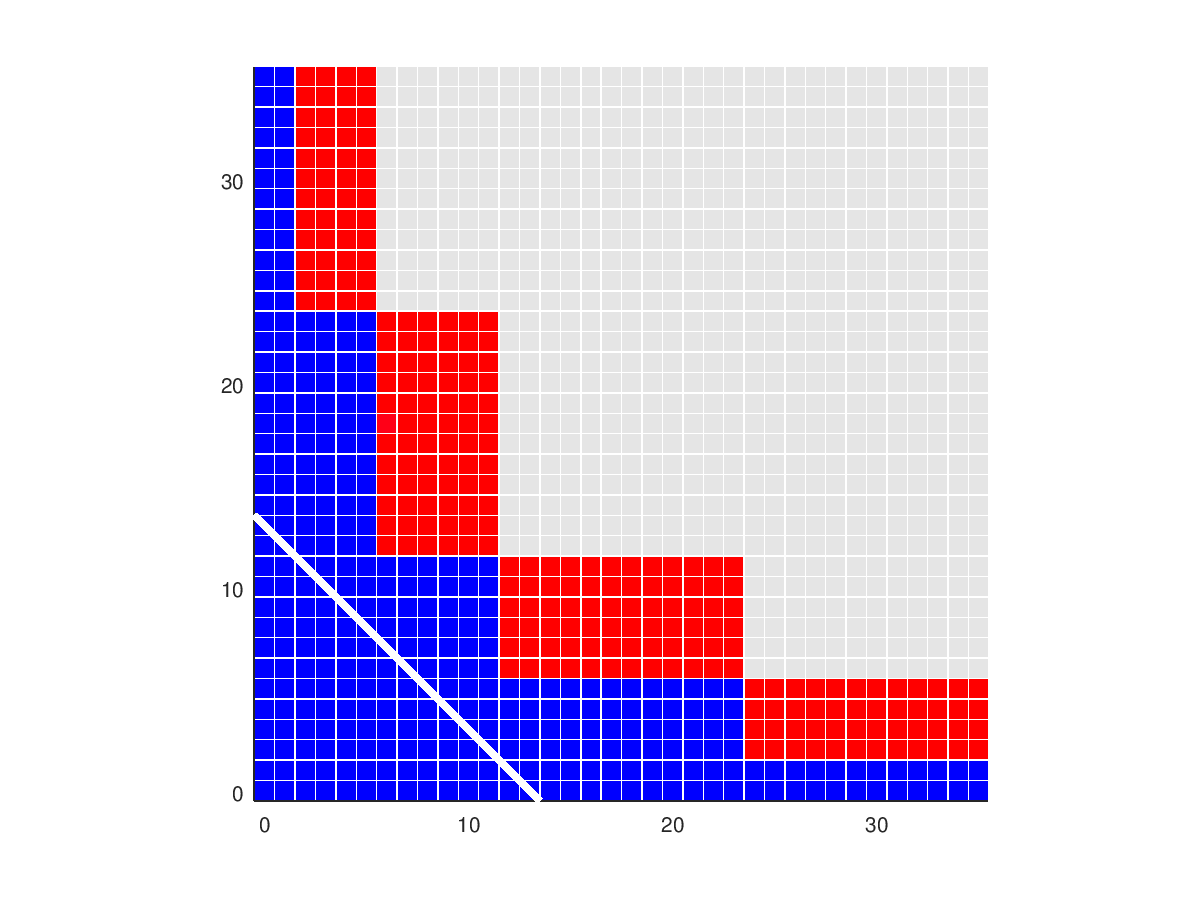
CC looks at the monomials that are exactly integrated by
2D Clenshaw-Curtis sparse grids of levels 0 through 6, using a common
35x35 grid.
-
cc_level0.txt,
the coordinates and colors.
-
cc_level0.png,
-
cc_level1.txt,
the coordinates and colors.
-
cc_level1.png,
-
cc_level2.txt,
the coordinates and colors.
-
cc_level2.png,
-
cc_level3.txt,
the coordinates and colors.
-
cc_level3.png,
-
cc_level4.txt,
the coordinates and colors.
-
cc_level4.png,
-
cc_level5.txt,
the coordinates and colors.
-
cc_level5.png,
-
cc_level6.txt,
the coordinates and colors.
-
cc_level6.png,
(note that the data in columns 0 and 1, and rows 0 and 1,
goes off the scale, to 65).
CCS looks at the monomials that are exactly integrated by
2D Clenshaw-Curtis "Slow exponential" sparse grids of levels 0 through
6, using a common 35x35 grid. This is a variant of the Clenshaw Curtis
rule that tries to delay the exponential growth of the orders. Differences
only appear once level 4 has been reached.
-
ccs_level0.txt,
the coordinates and colors.
-
ccs_level0.png,
-
ccs_level1.txt,
the coordinates and colors.
-
ccs_level1.png,
-
ccs_level2.txt,
the coordinates and colors.
-
ccs_level2.png,
-
ccs_level3.txt,
the coordinates and colors.
-
ccs_level3.png,
-
ccs_level4.txt,
the coordinates and colors.
-
ccs_level4.png,
-
ccs_level5.txt,
the coordinates and colors.
-
ccs_level5.png,
-
ccs_level6.txt,
the coordinates and colors.
-
ccs_level6.png,
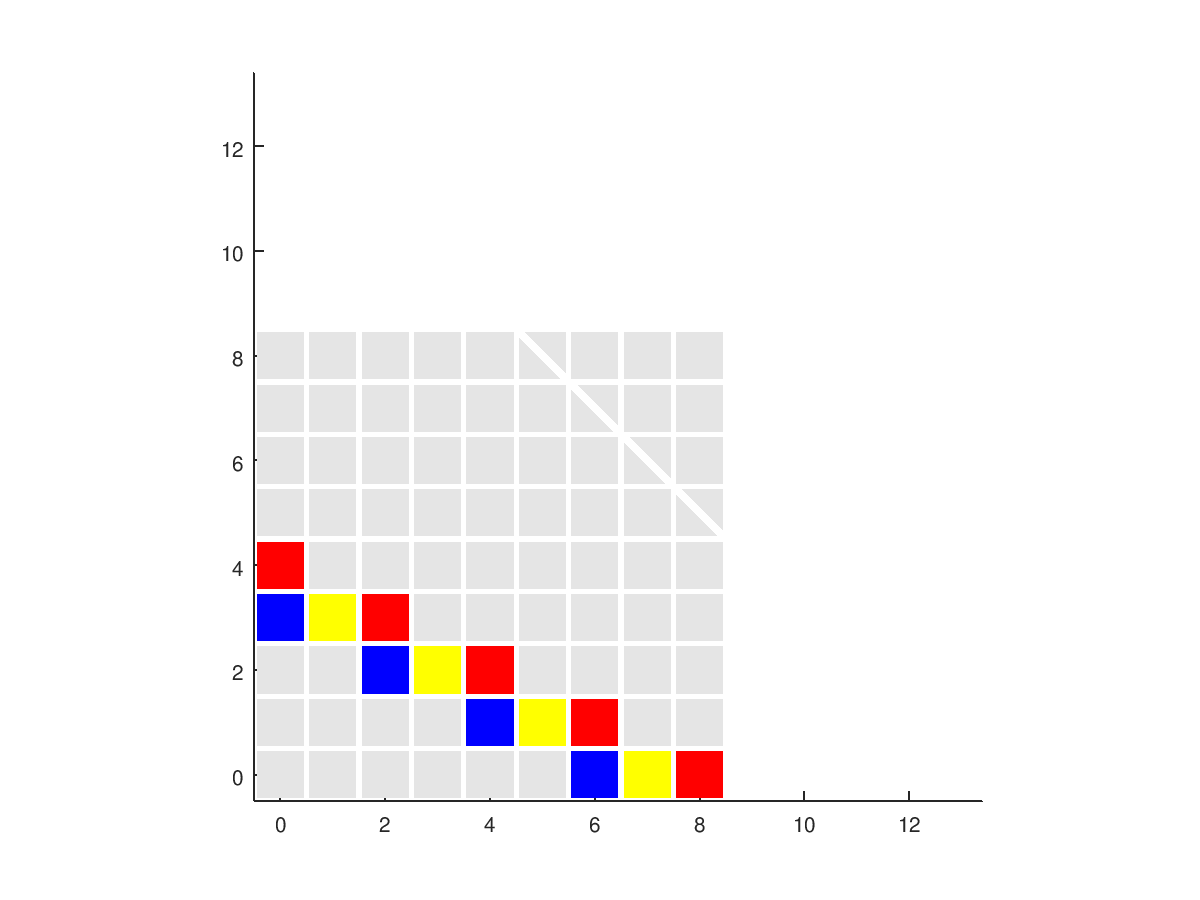
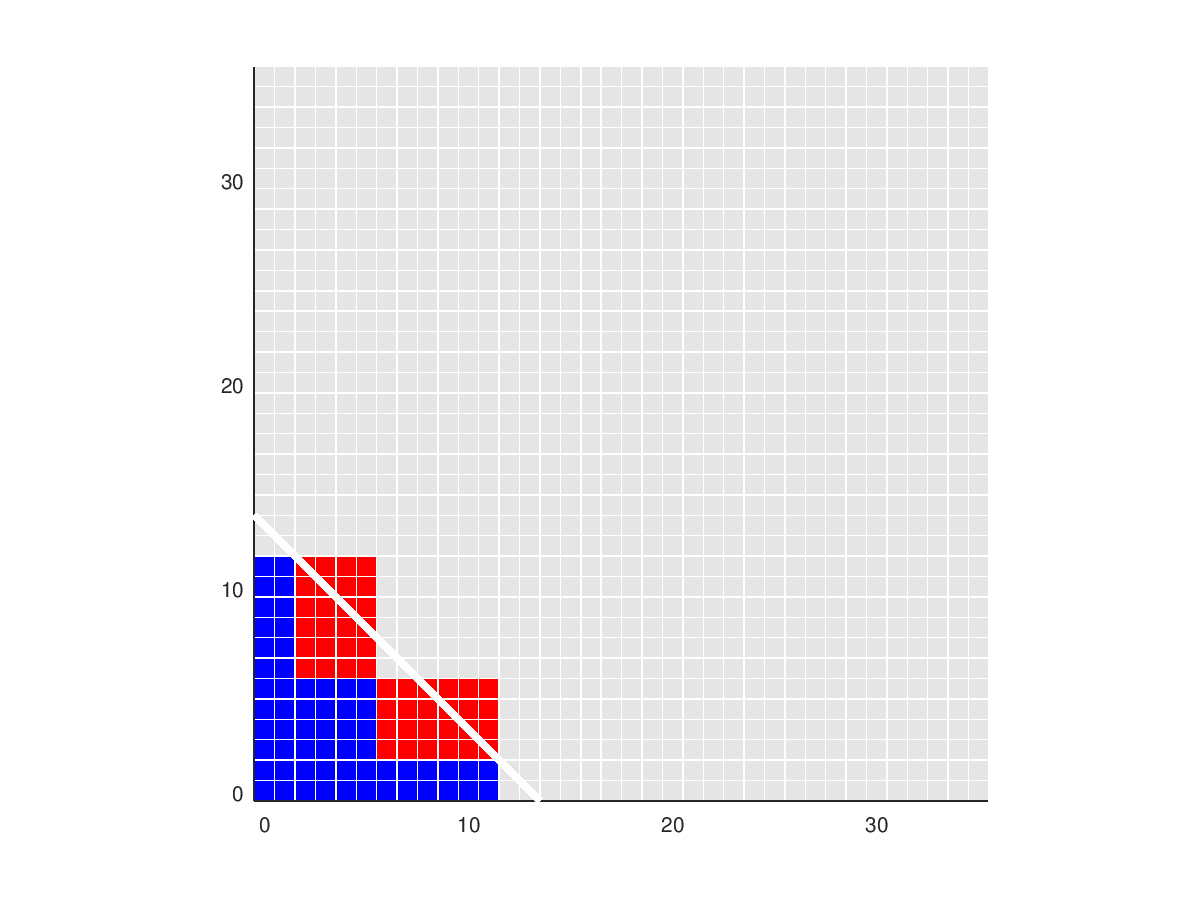
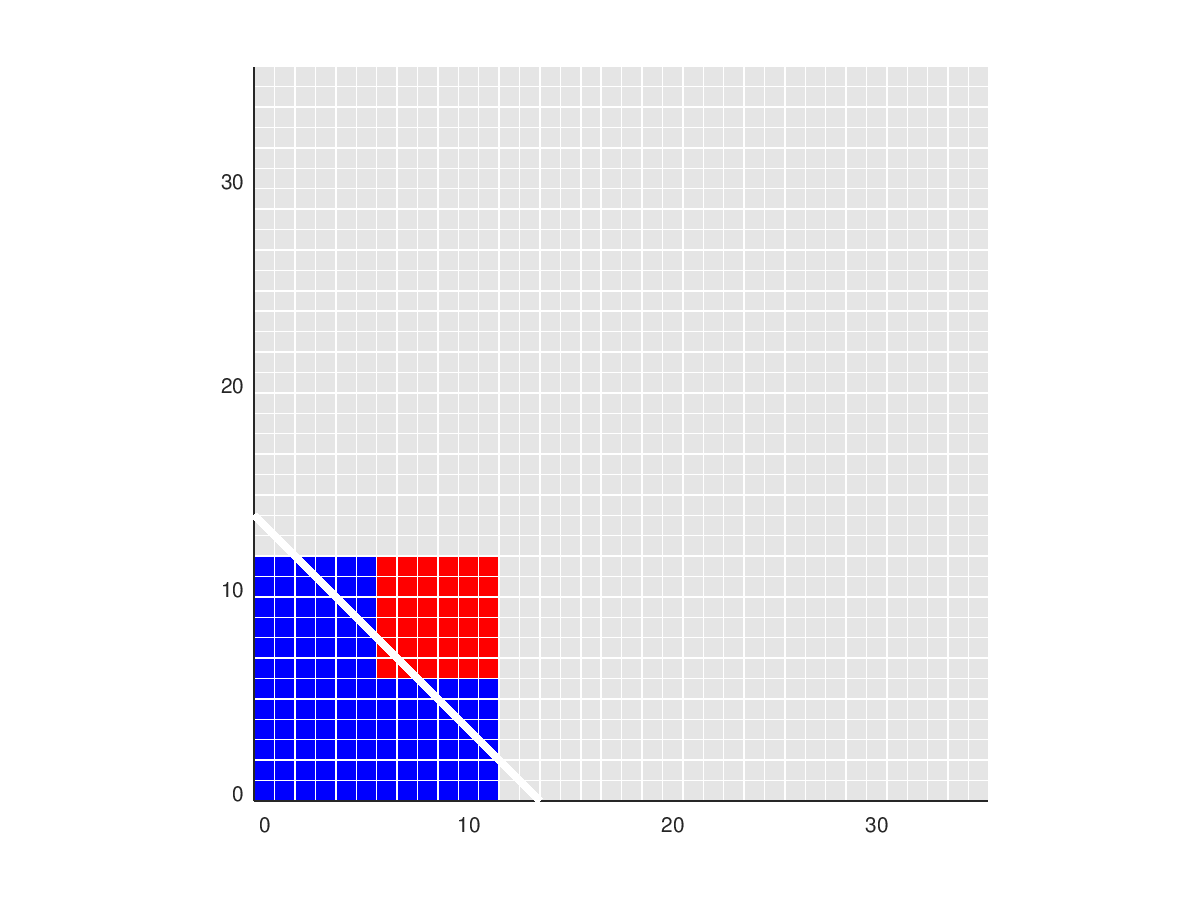
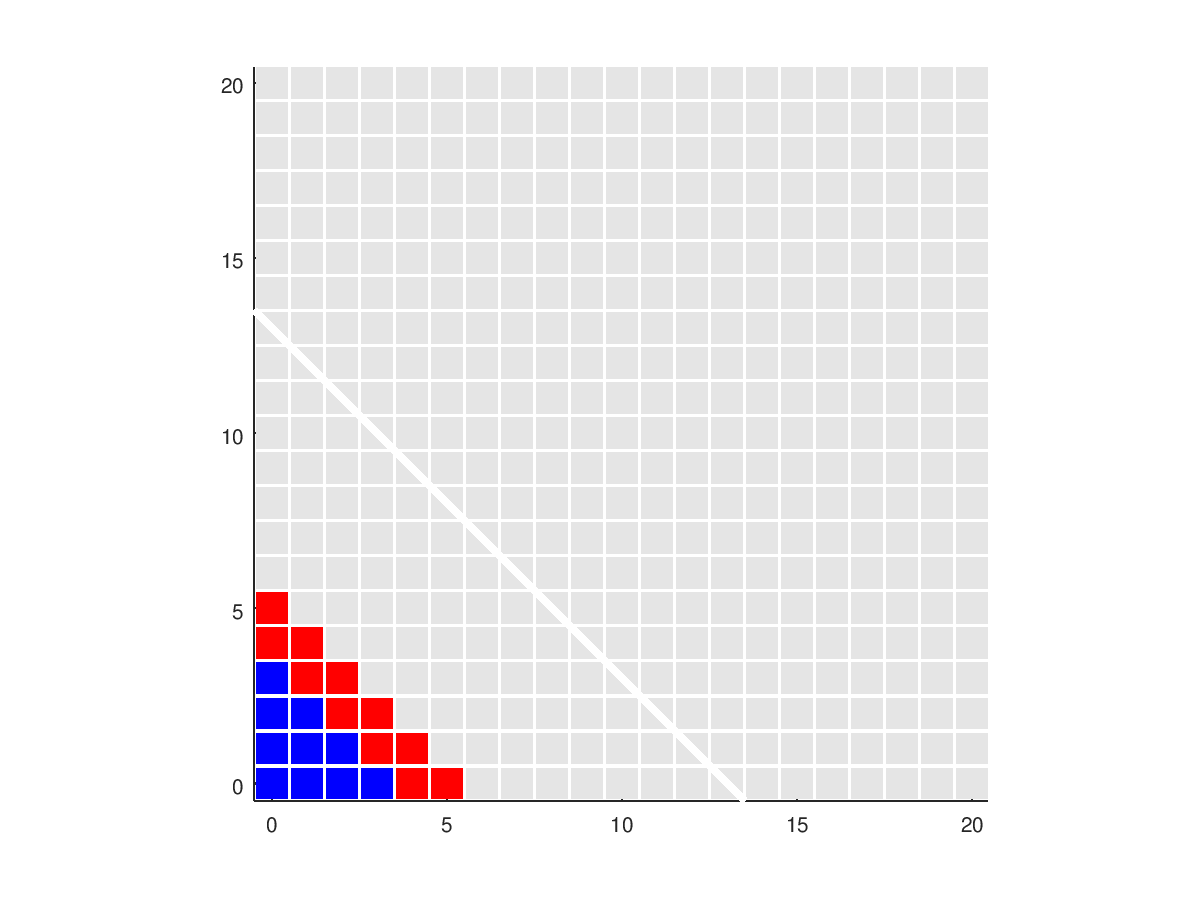
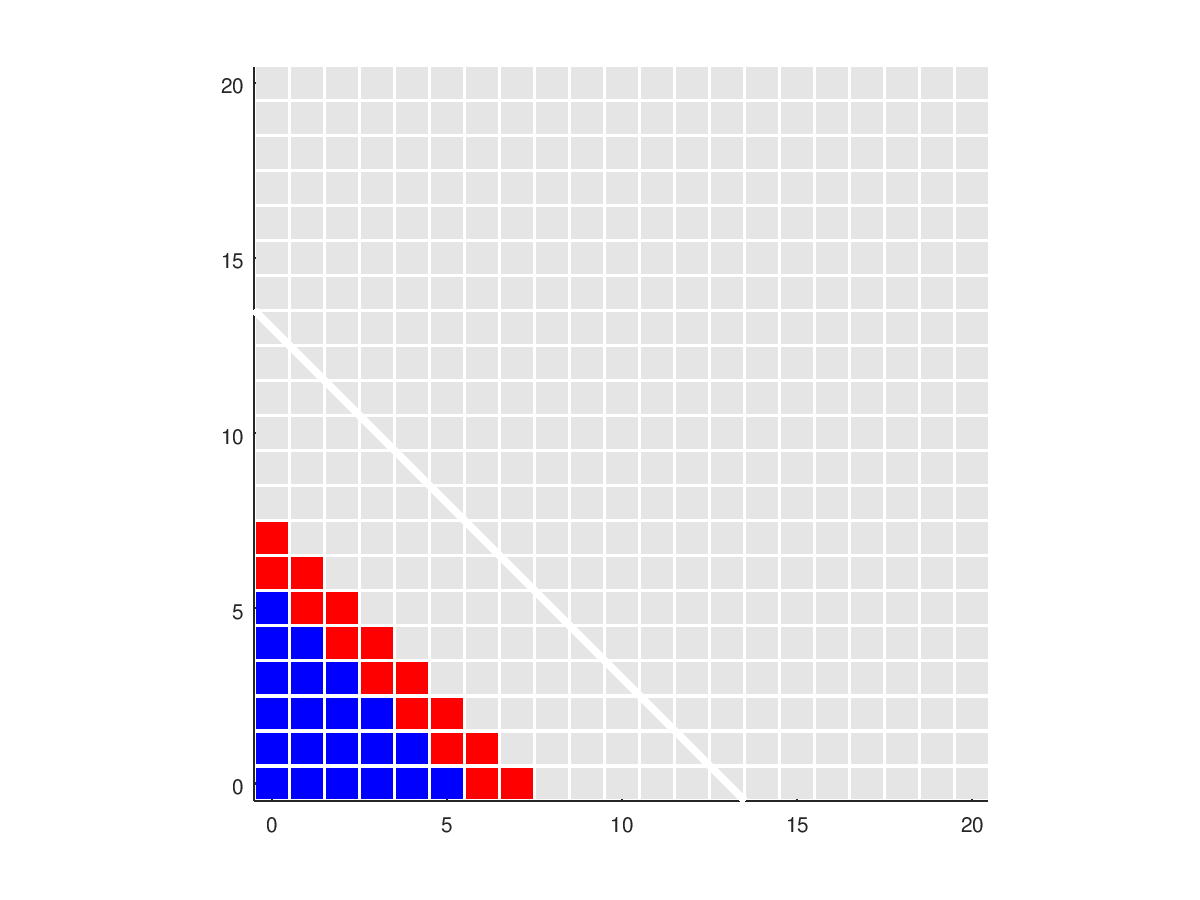
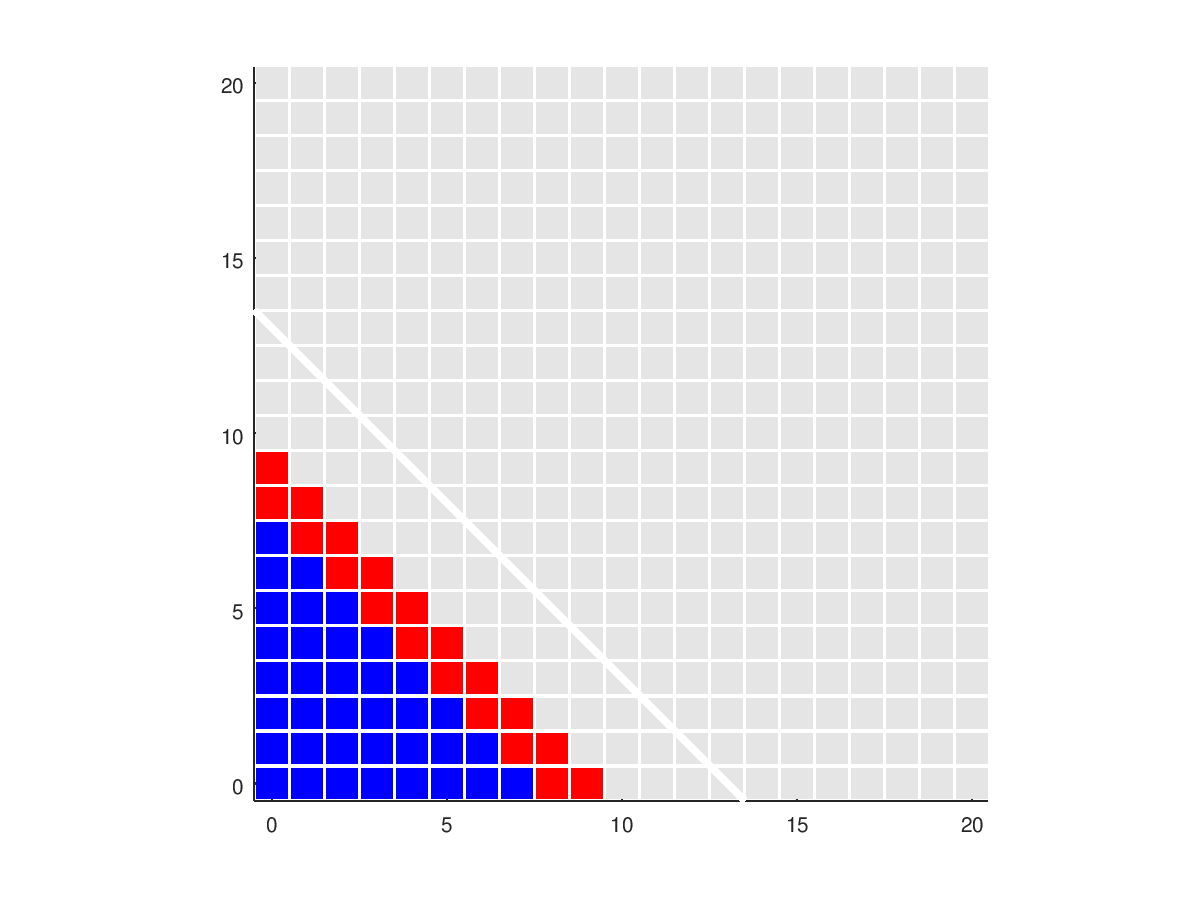
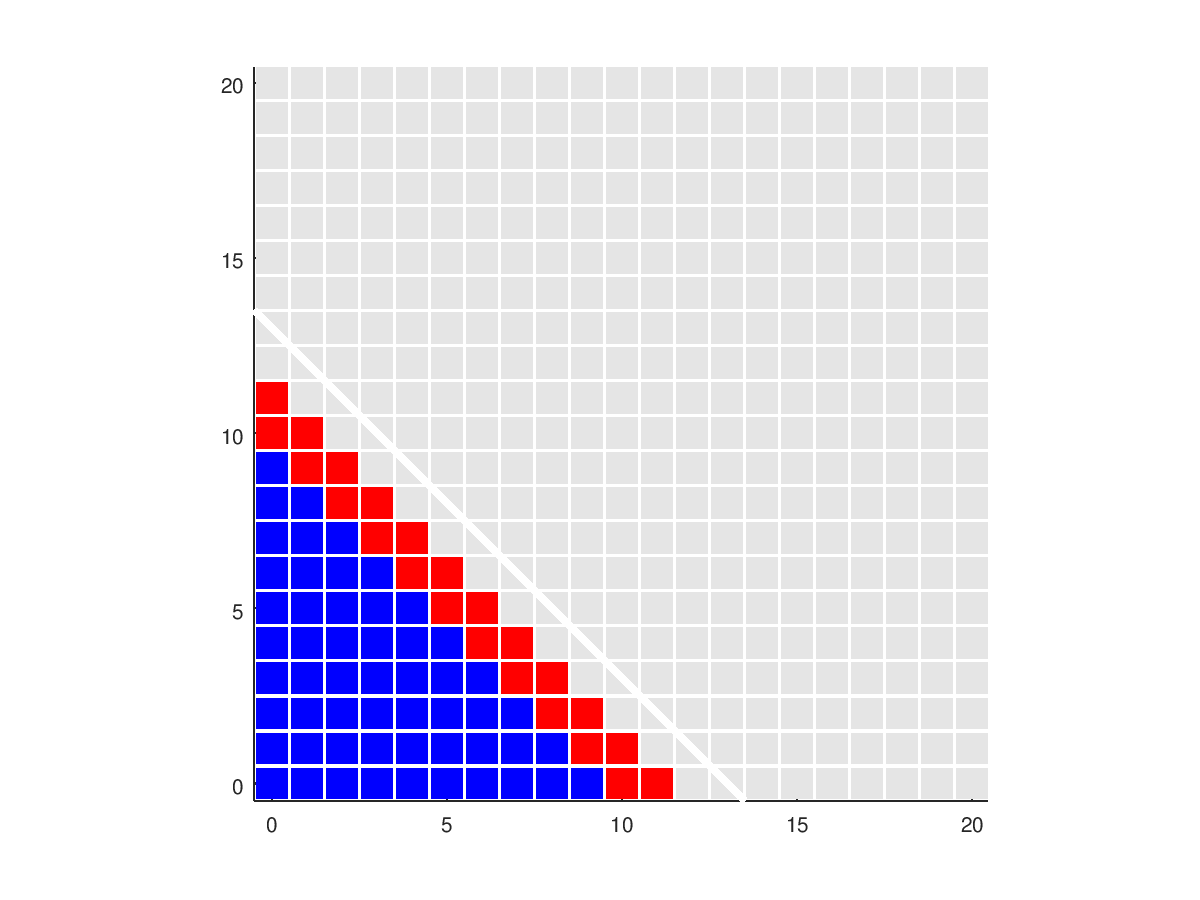
CGW looks at the first eight rules in an anisotropic
sparse grid that has double the growth in X as in Y:
-
cgw_boxes_level0.txt,
the coordinates and colors.
-
cgw_boxes_level0.png,
-
cgw_boxes_level1.txt,
the coordinates and colors.
-
cgw_boxes_level1.png,
-
cgw_boxes_level2.txt,
the coordinates and colors.
-
cgw_boxes_level2.png,
-
cgw_boxes_level3.txt,
the coordinates and colors.
-
cgw_boxes_level3.png,
-
cgw_boxes_level4.txt,
the coordinates and colors.
-
cgw_boxes_level4.png,
-
cgw_boxes_level5.txt,
the coordinates and colors.
-
cgw_boxes_level5.png,
-
cgw_boxes_level6.txt,
the coordinates and colors.
-
cgw_boxes_level6.png,
-
cgw_boxes_level7.txt,
the coordinates and colors.
-
cgw_boxes_level7.png,
-
cgw_boxes_level8.txt,
the coordinates and colors.
-
cgw_boxes_level8.png,
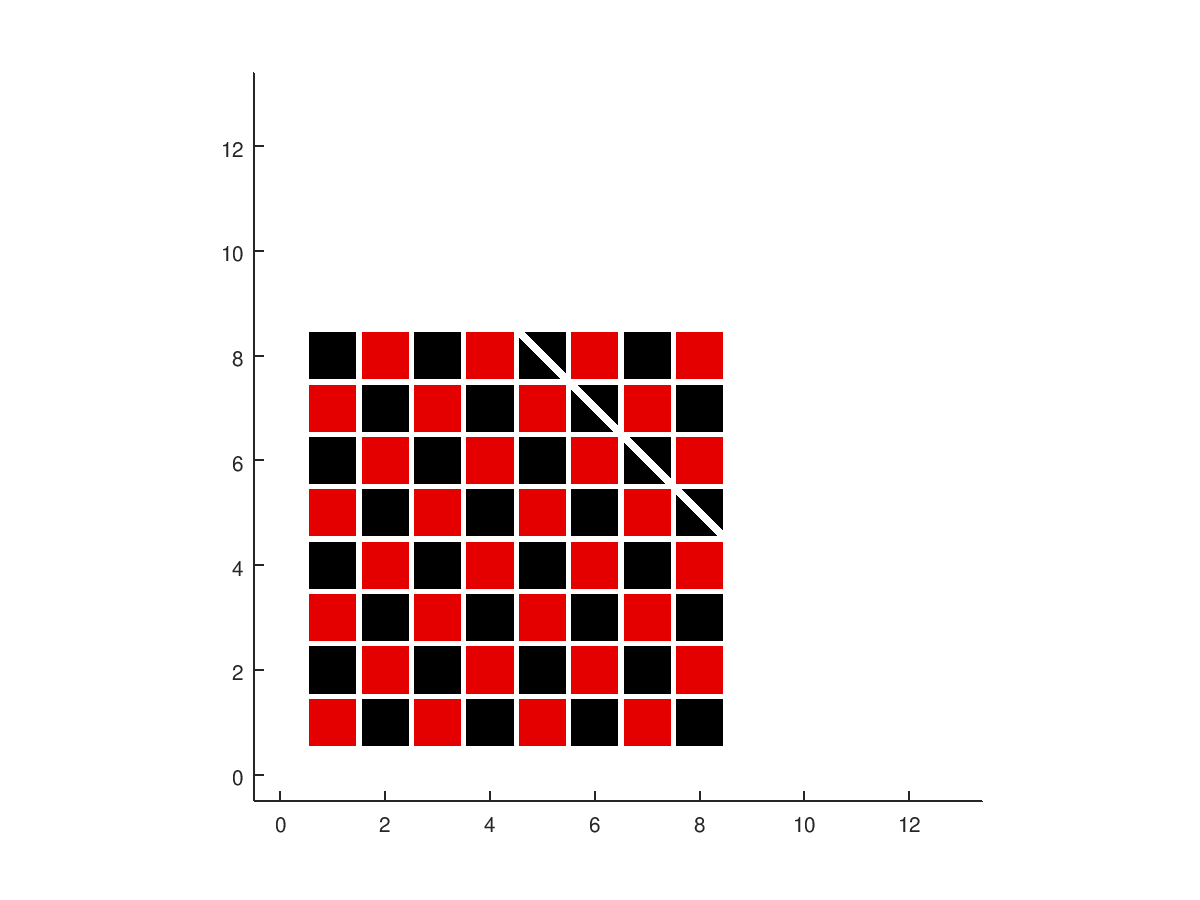
CHECKERBOARD is a set of 64 pairs of integers and colors
that correspond to a checkerboard.
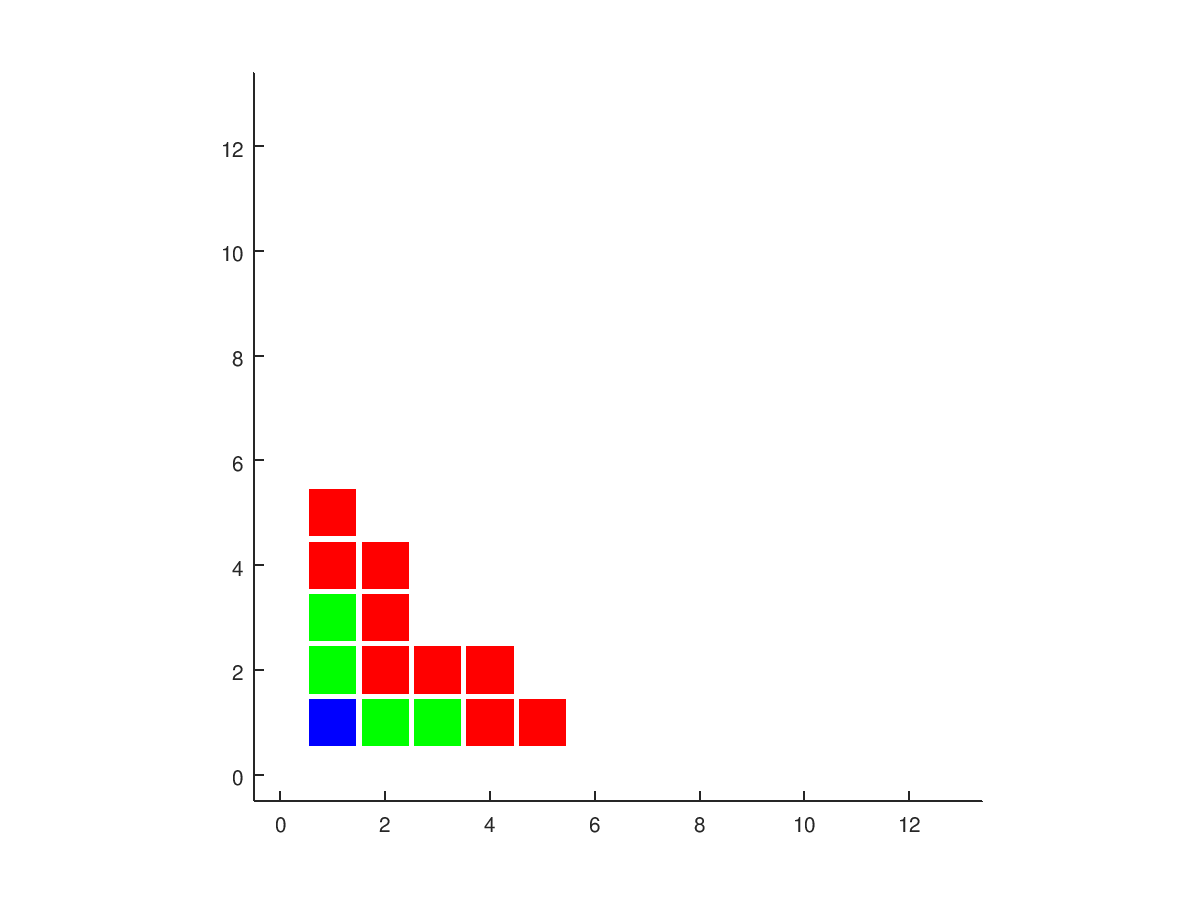
CLAY is a set of pairs of integers that record the
basic method (1,1) in blue, some low order methods in green,
and secondary refinements in red.
-
clay.txt,
the coordinates and colors.
-
clay.png,
a PNG image of a plot of the points.
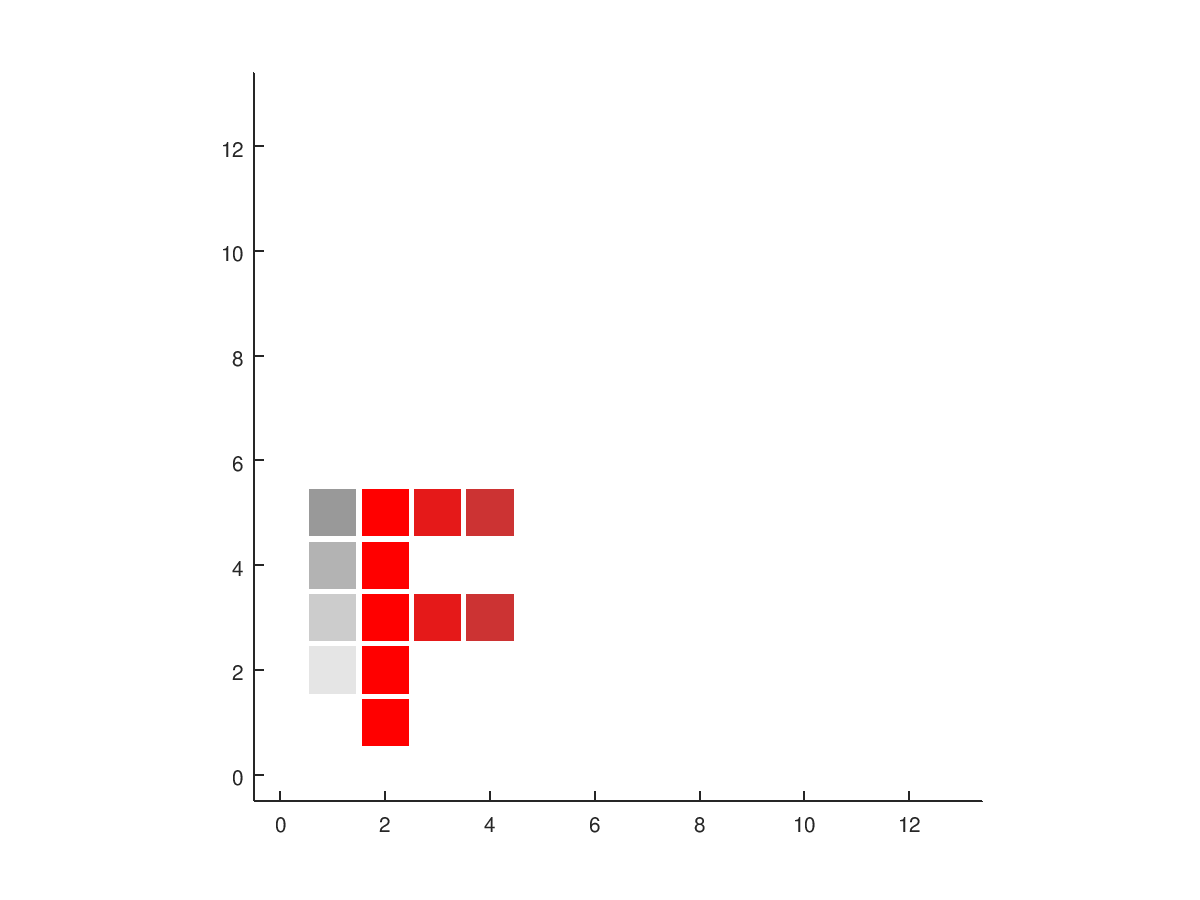
F is a set of points that can make the letter F:
-
f.txt,
the coordinates and colors.
-
f.png,
a PNG image of a plot of the points.
GP looks at the monomials that are exactly integrated by
2D Gauss-Patterson sparse grids of levels 0 through
5, using a common 35x35 grid.
-
gp_level0.txt,
the coordinates and colors.
-
gp_level0.png,
-
gp_level1.txt,
the coordinates and colors.
-
gp_level1.png,
-
gp_level2.txt,
the coordinates and colors.
-
gp_level2.png,
-
gp_level3.txt,
the coordinates and colors.
-
gp_level3.png,
-
gp_level4.txt,
the coordinates and colors.
-
gp_level4.png,
-
gp_level5.txt,
the coordinates and colors.
-
gp_level5.png,
GPS looks at the monomials that are exactly integrated by
2D slow-growth Gauss-Patterson sparse grids of levels 0 through
5, using a common 35x35 grid.
-
gps_level0.txt,
the coordinates and colors.
-
gps_level0.png,
-
gps_level1.txt,
the coordinates and colors.
-
gps_level1.png,
-
gps_level2.txt,
the coordinates and colors.
-
gps_level2.png,
-
gps_level3.txt,
the coordinates and colors.
-
gps_level3.png,
-
gps_level4.txt,
the coordinates and colors.
-
gps_level4.png,
-
gps_level5.txt,
the coordinates and colors.
-
gps_level5.png,
SM symbolically displays the monomials that will be integrated
precisely by a Smolyak sparse grid rule of given level if the 1D factor
rules form a family of precisions at least 1, 3, 5, 7, 9, ...
-
boxes_level0.txt,
the coordinates and colors.
-
sm_level0.png,
a PNG image of a plot of the points.
-
sm_level1.txt,
the coordinates and colors.
-
sm_level1.png,
a PNG image of a plot of the points.
-
sm_level2.txt,
the coordinates and colors.
-
sm_level2.png,
a PNG image of a plot of the points.
-
sm_level3.txt,
the coordinates and colors.
-
sm_level3.png,
a PNG image of a plot of the points.
-
sm_level4.txt,
the coordinates and colors.
-
sm_level4.png,
a PNG image of a plot of the points.
-
sm_level5.txt,
the coordinates and colors.
-
sm_level5.png,
a PNG image of a plot of the points.
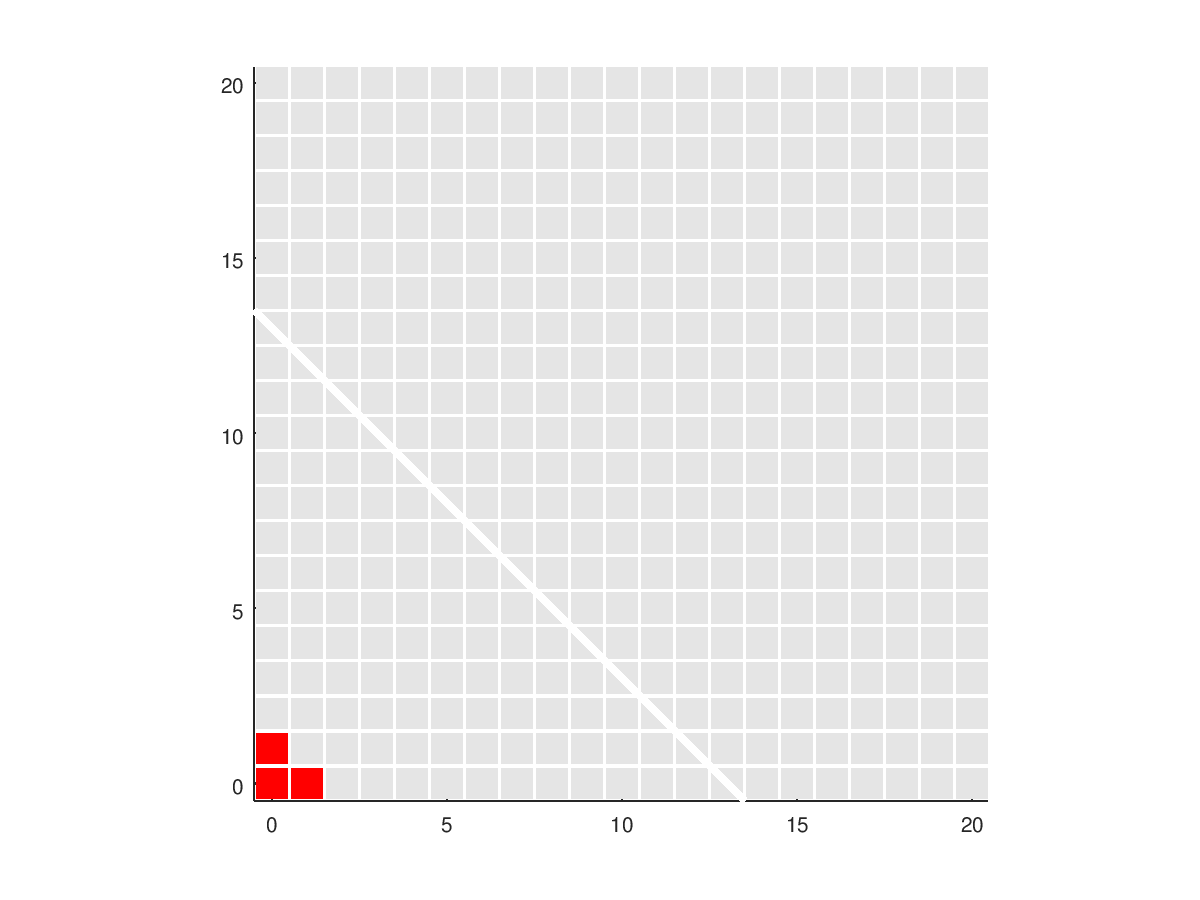
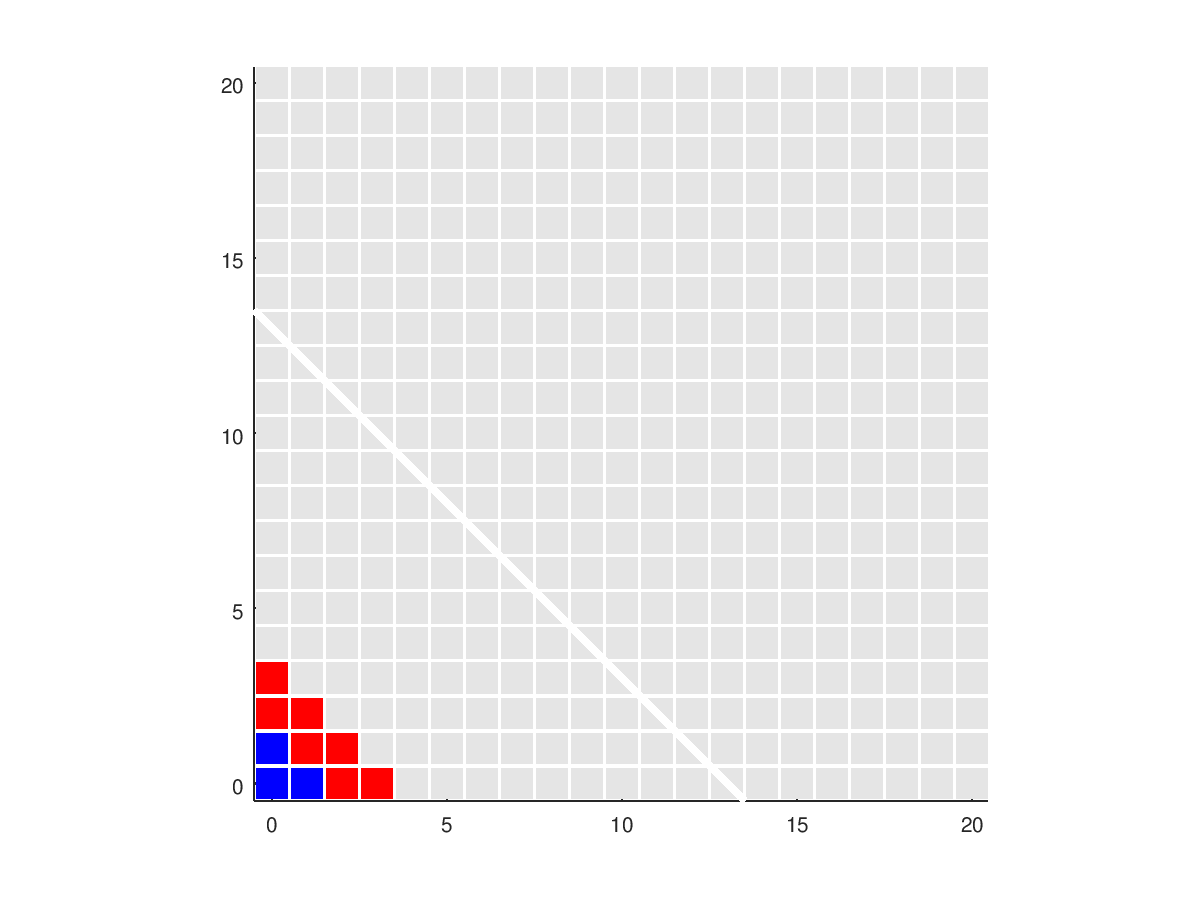
SPARSE is a sequence of plots that suggest how a sparse grid
is put together in such a way as to capture all monomials up to a
specific total degree.
-
sparse1.txt,
indicates the monomials to be captured.
-
sparse1.png,
a PNG image of a plot of the points.
-
sparse2.txt,
shows how a product rule would capture the monomials (and more).
-
sparse2.png,
a PNG image of a plot of the points.
-
sparse3.txt,
begins a sparse grid by adding Q(0x3).
-
sparse3.png,
a PNG image of a plot of the points.
-
sparse4.txt,
continues a sparse grid by adding Q(2x2).
-
sparse4.png,
a PNG image of a plot of the points.
-
sparse5.txt,
continues a sparse grid by subtracting Q(0x2).
-
sparse5.png,
a PNG image of a plot of the points.
-
sparse6.txt,
continues a sparse grid by adding Q(2x1).
-
sparse6.png,
a PNG image of a plot of the points.
-
sparse7.txt,
continues a sparse grid by subtracting Q(1x1).
-
sparse7.png,
a PNG image of a plot of the points.
-
sparse8.txt,
continues a sparse grid by adding Q(3,0).
-
sparse8.png,
a PNG image of a plot of the points.
-
sparse9.txt,
completes the sparse grid by subtracting Q(2x0).
-
sparse9.png,
a PNG image of a plot of the points.
Last revised on 03 December 2018.