box_display_test is a MATLAB program which calls box_display to create a plot over a range of integer boxes, whose default color is gray, but some of which can be painted red (new stuff) and some painted blue (old stuff)
The computer code and data files made available on this web page are distributed under the GNU LGPL license.
box_display, a MATLAB program which displays a box plot, over integer pairs of data, of a function defined by two formulas.
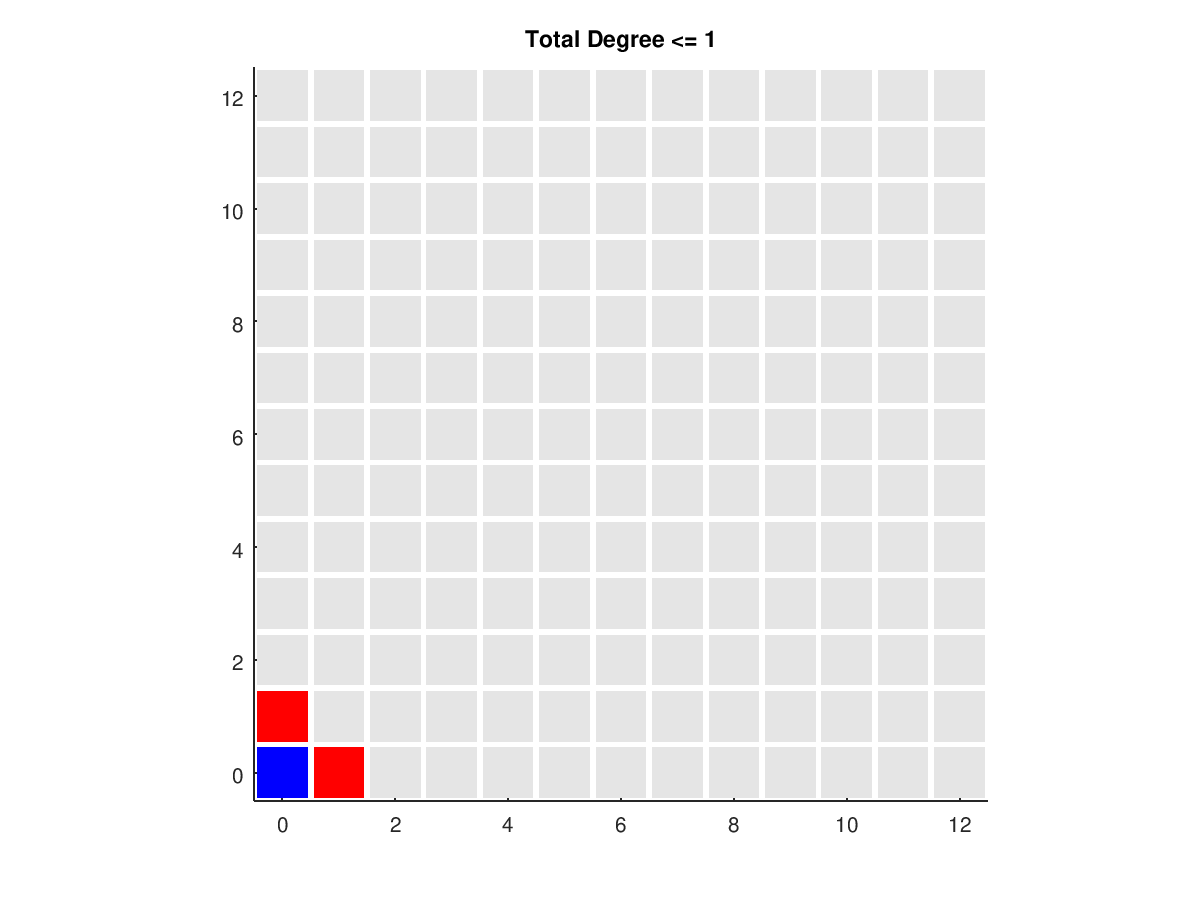
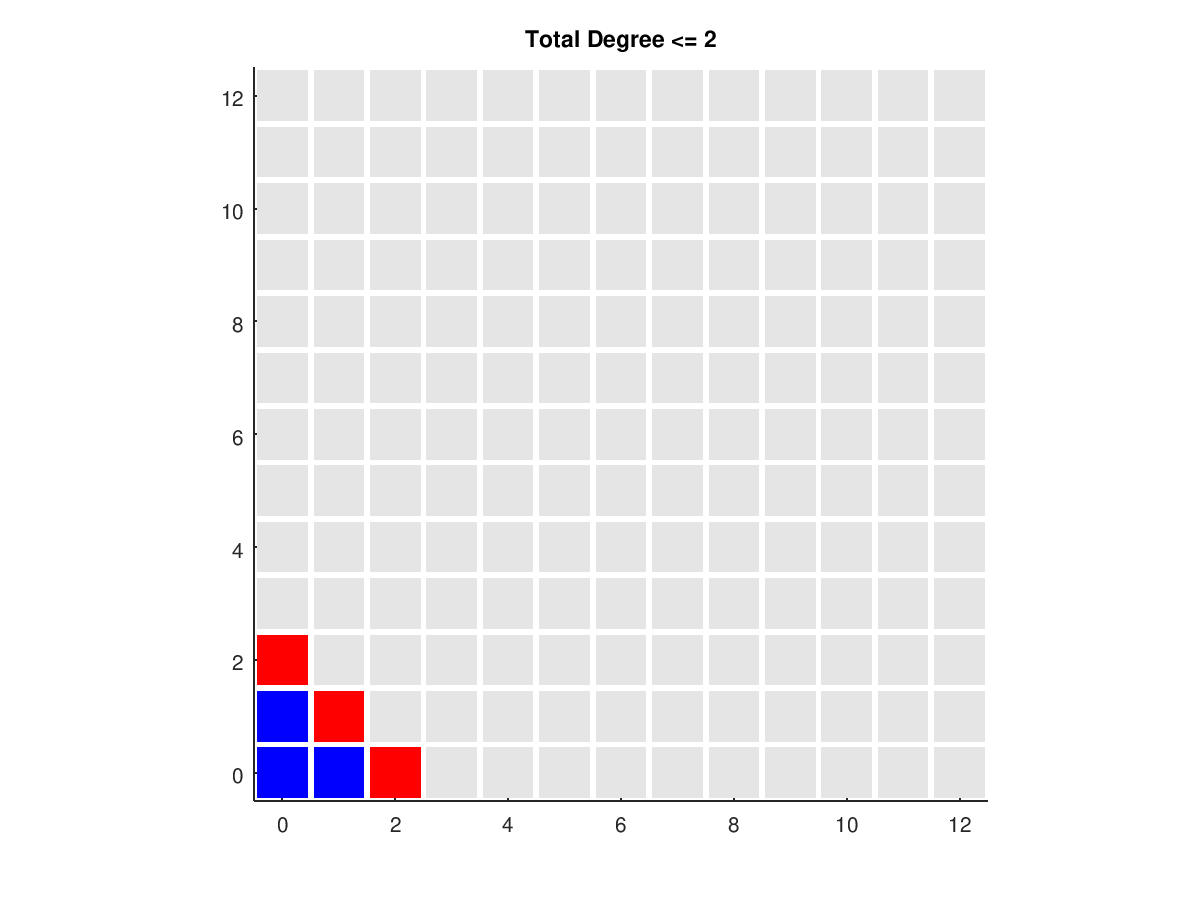
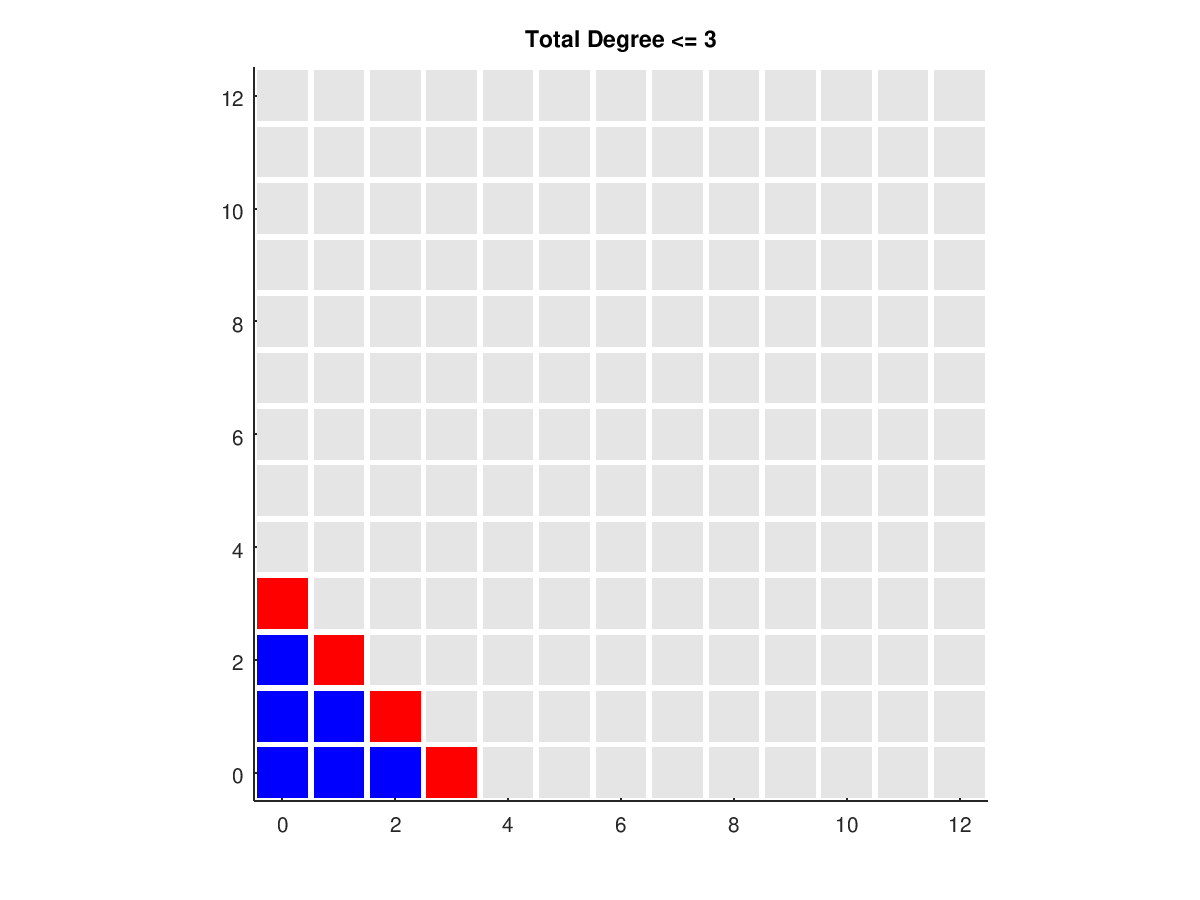
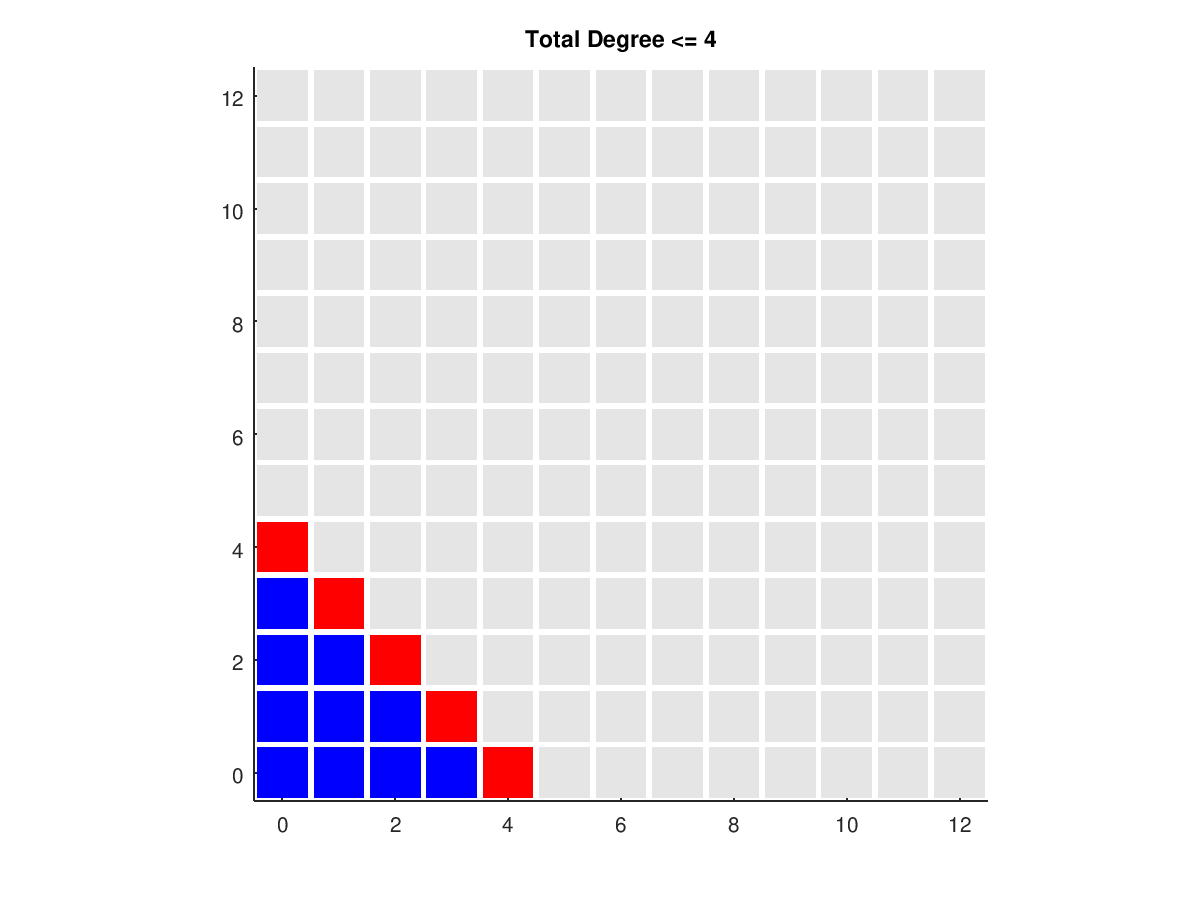
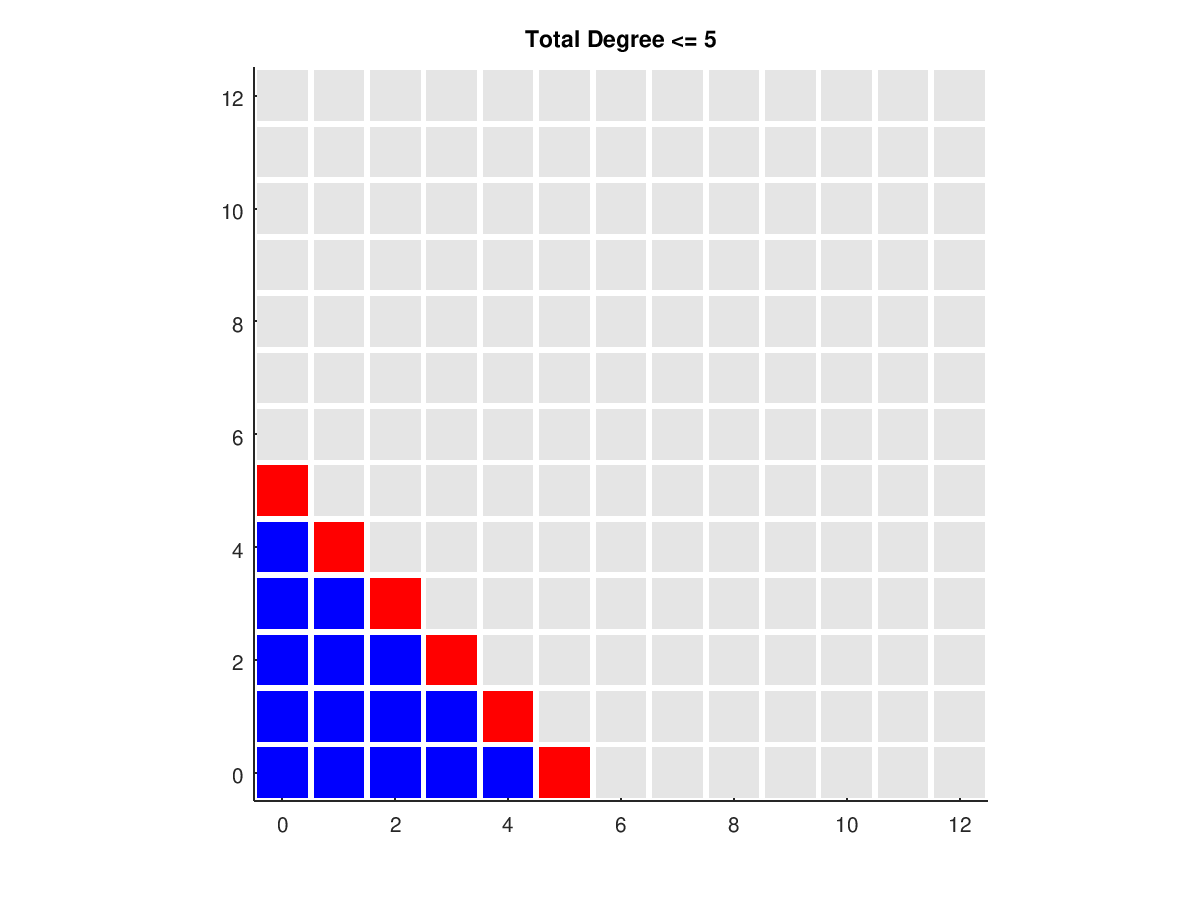
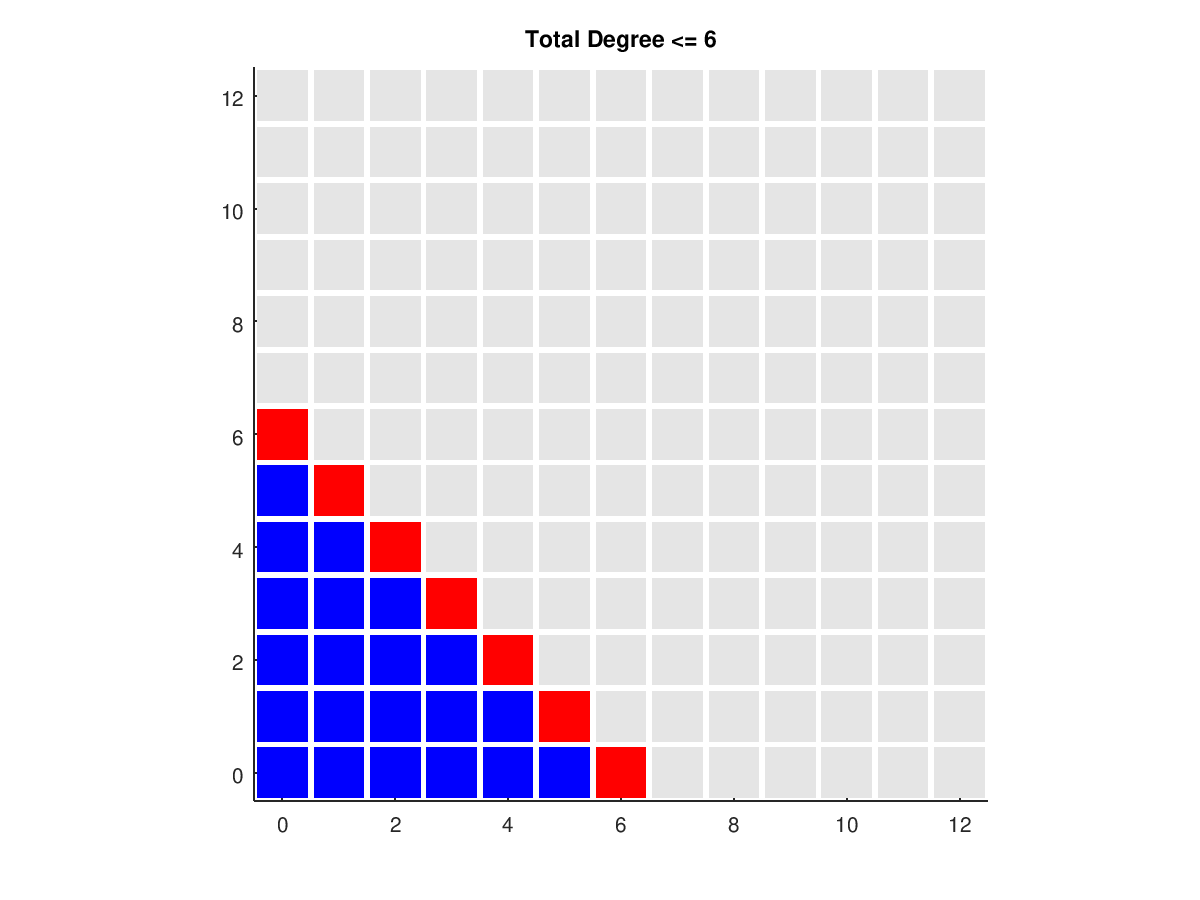
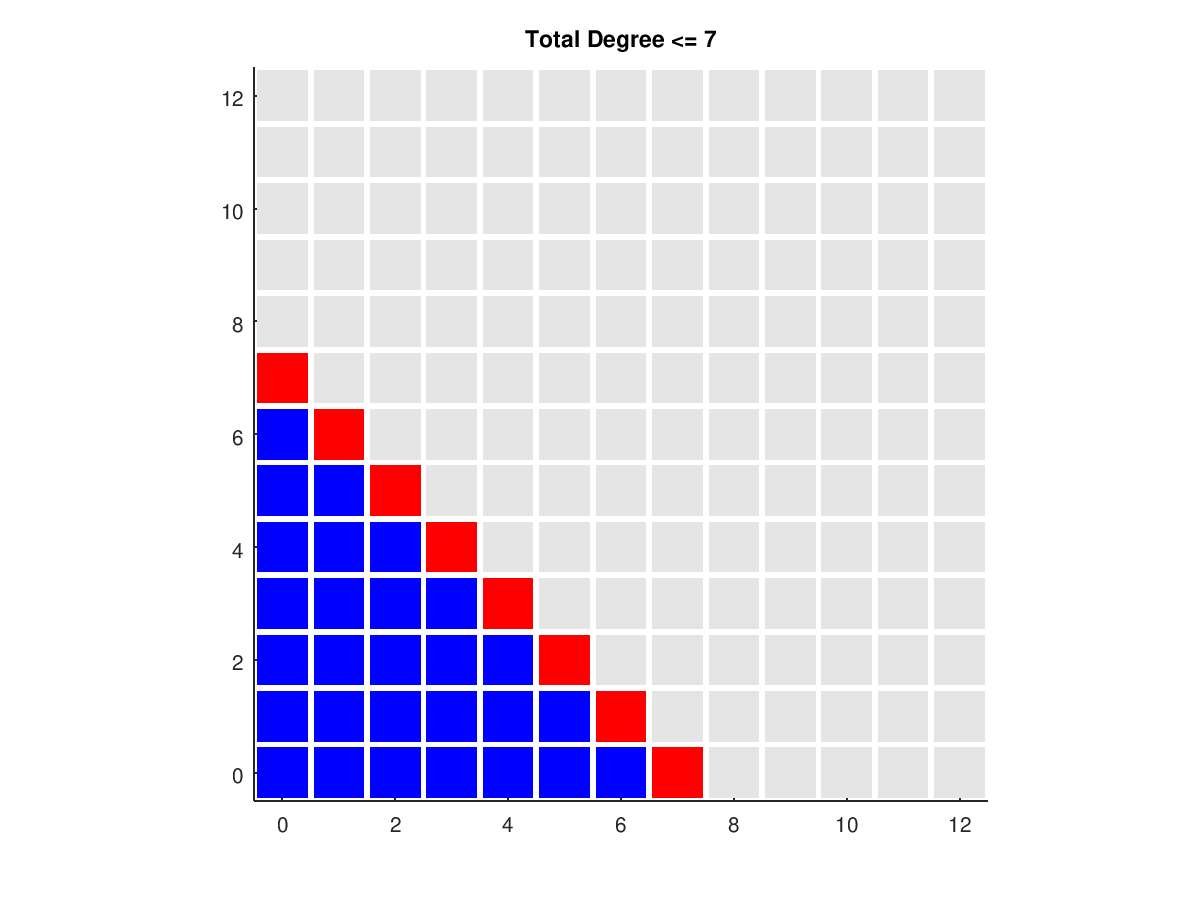
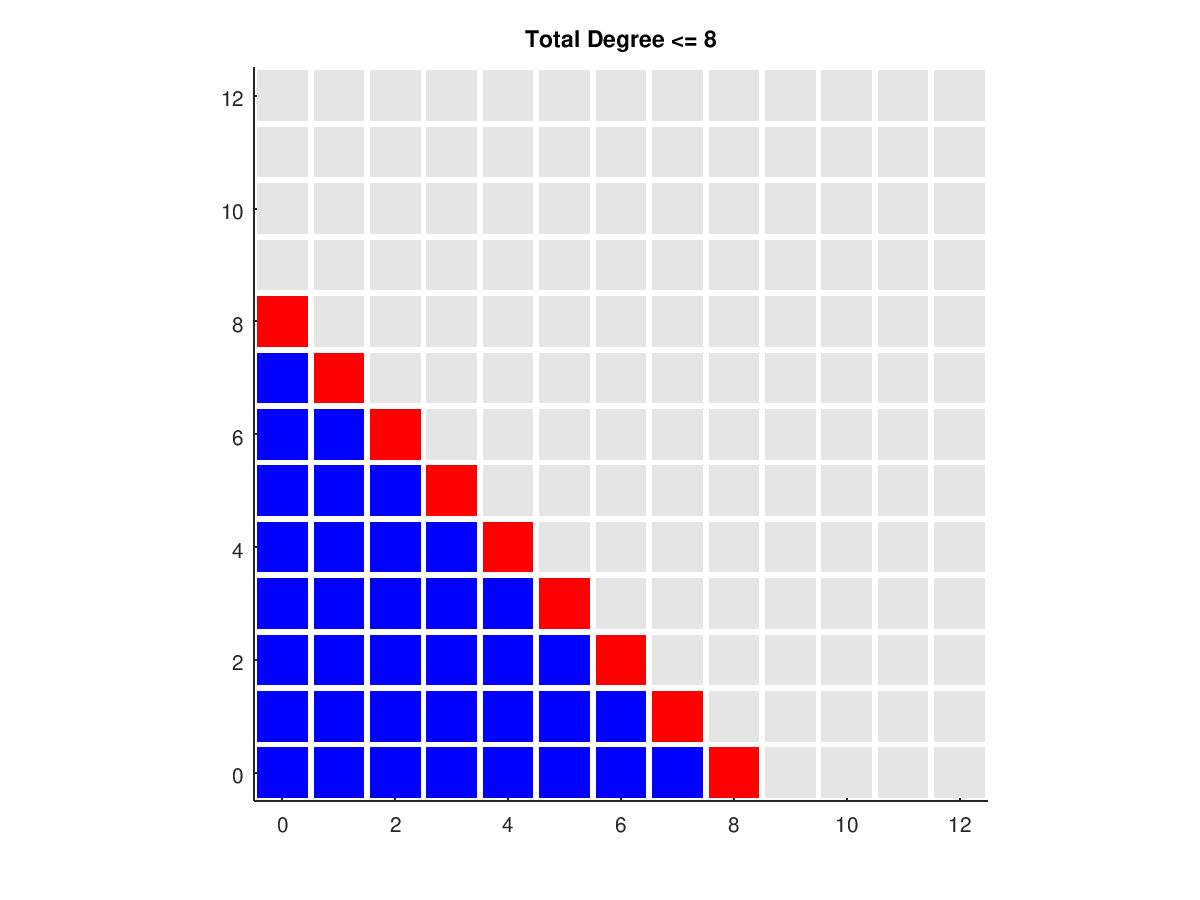
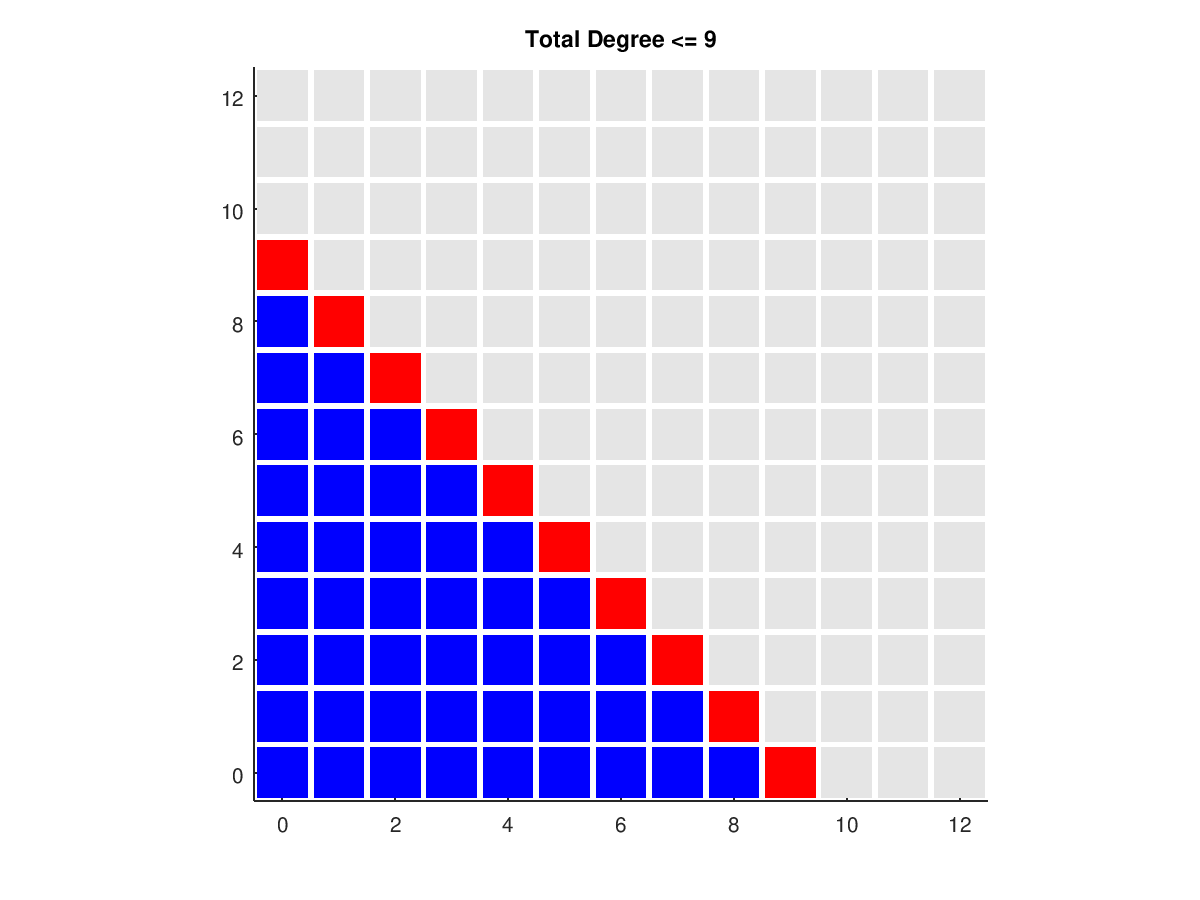
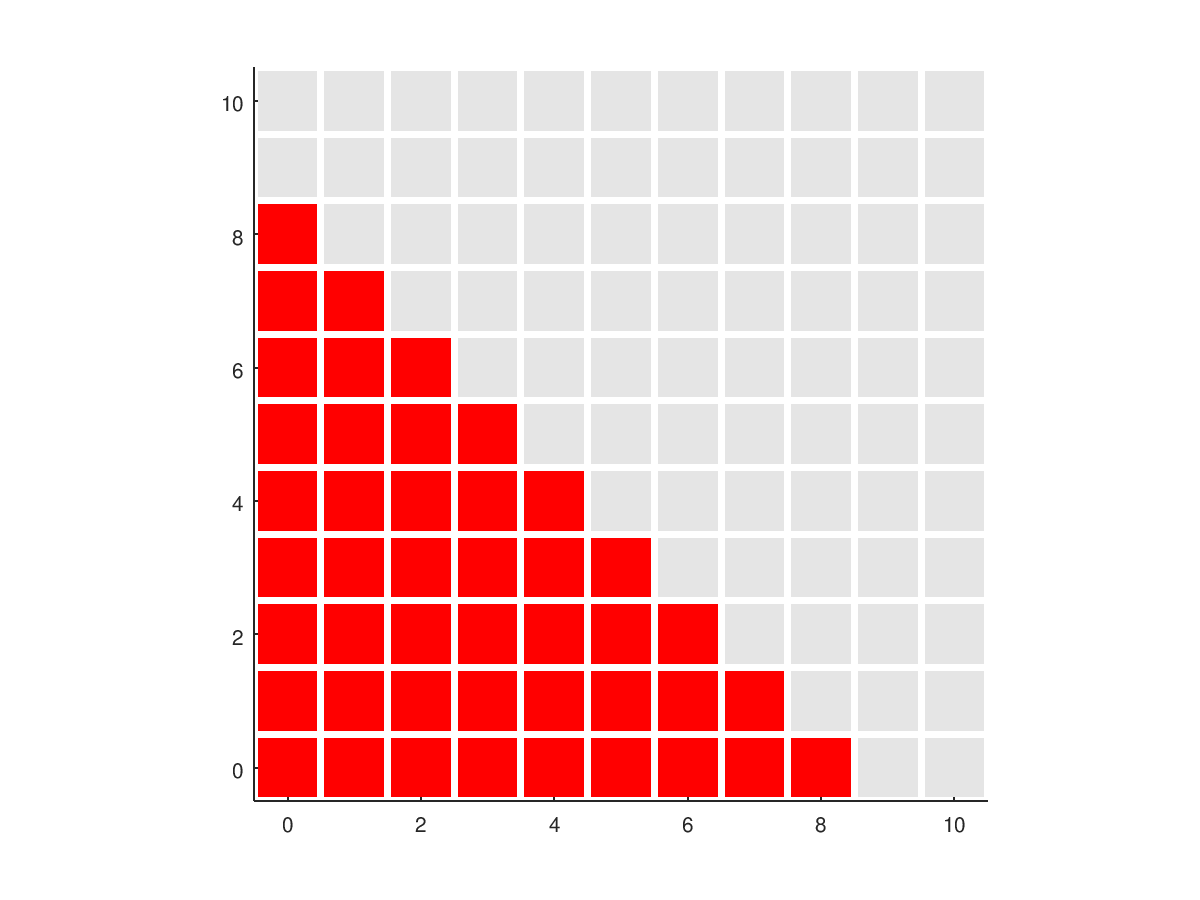
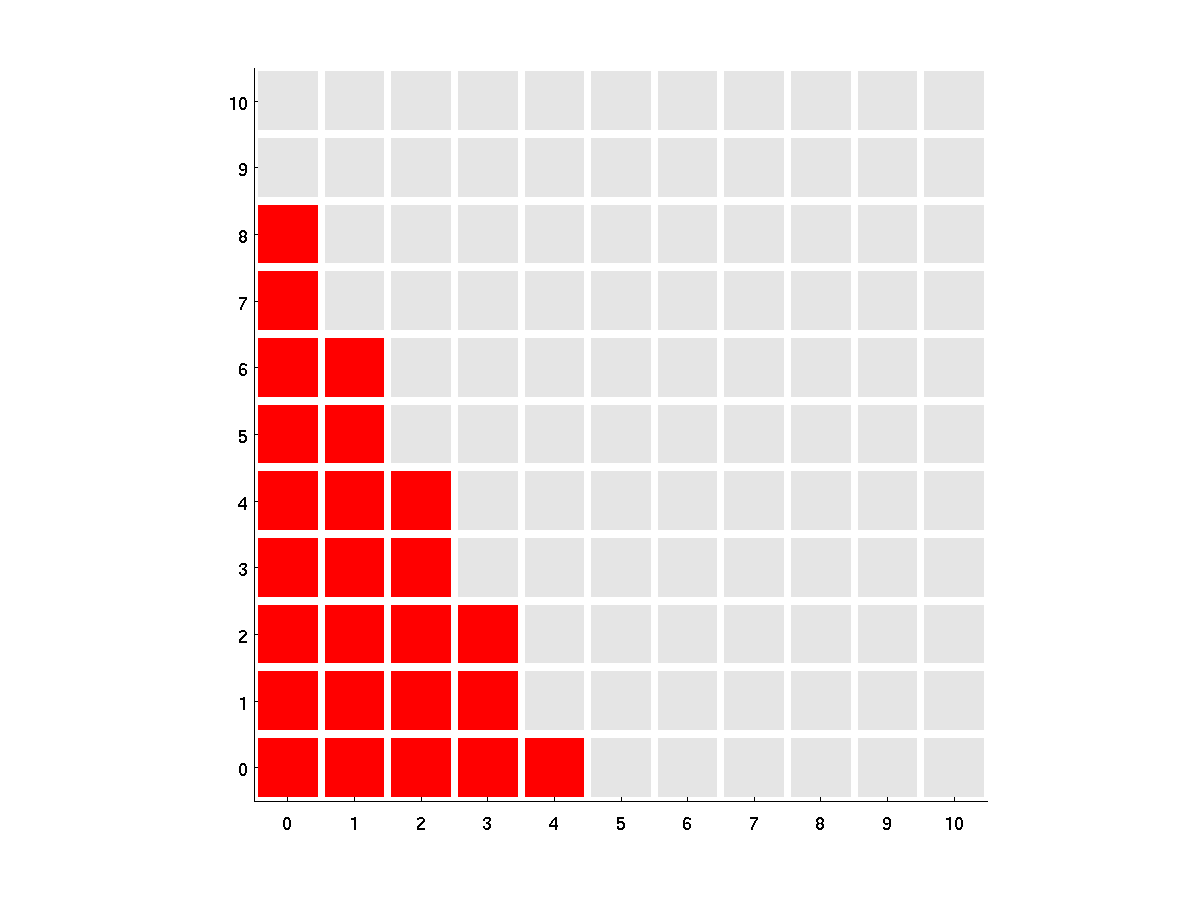
TD represents the total degree polynomials for which D1 + D2 <= L. Blue indicates "old" data, and red "new".
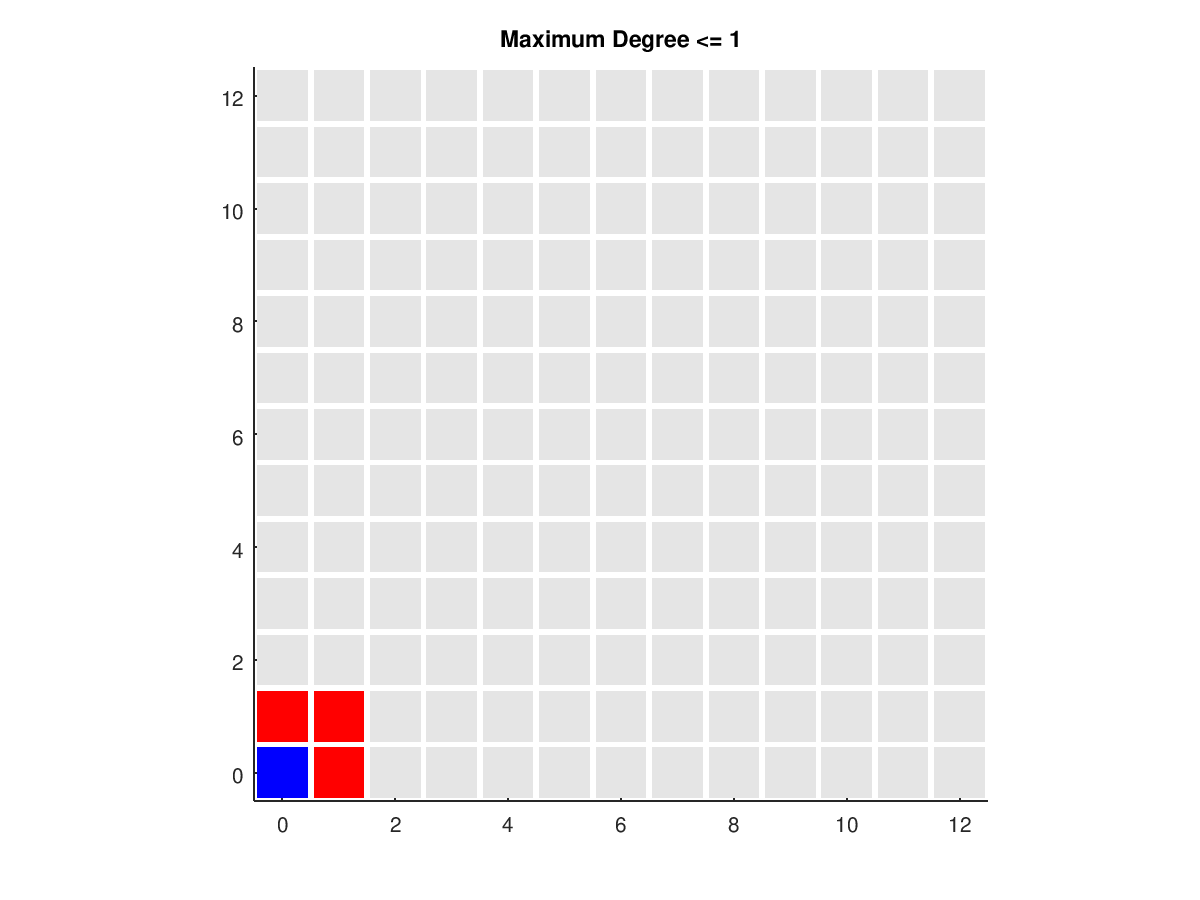
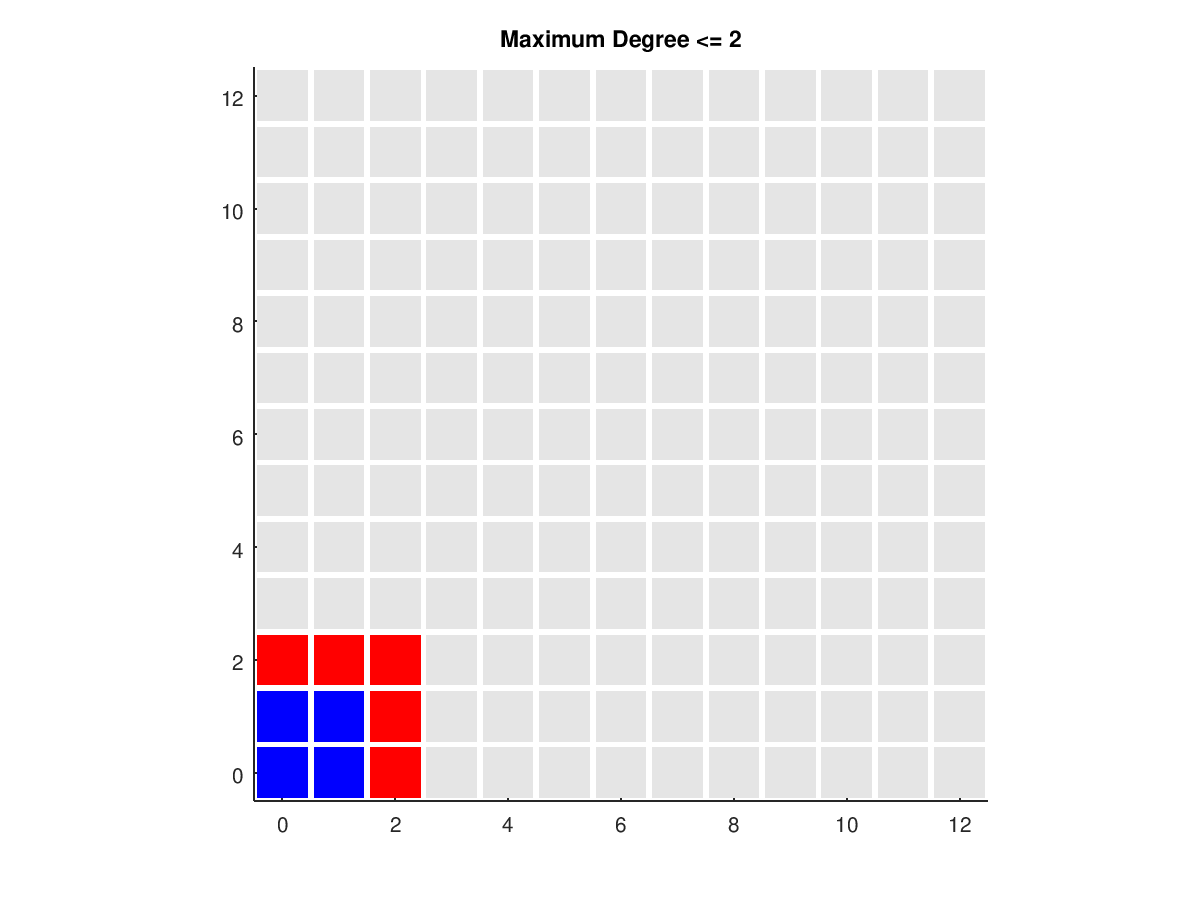
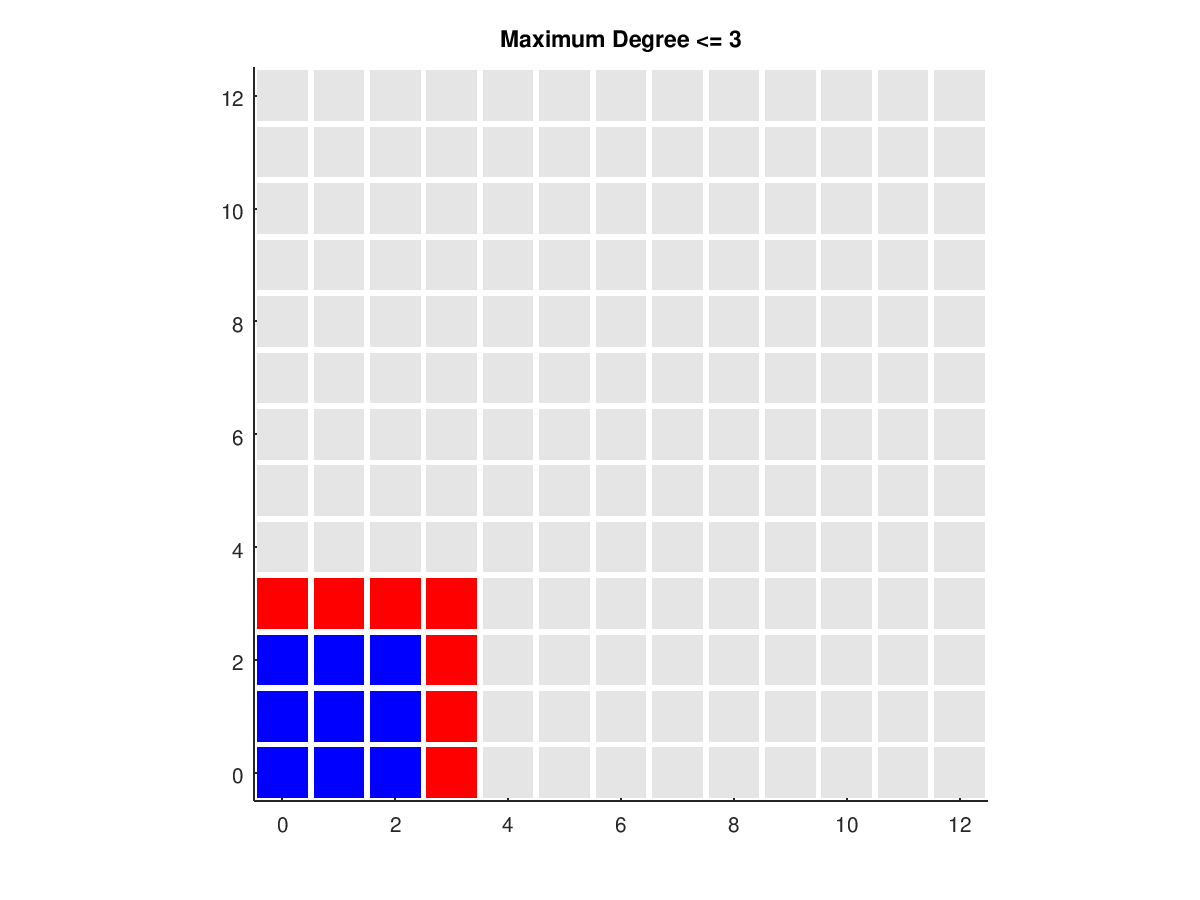
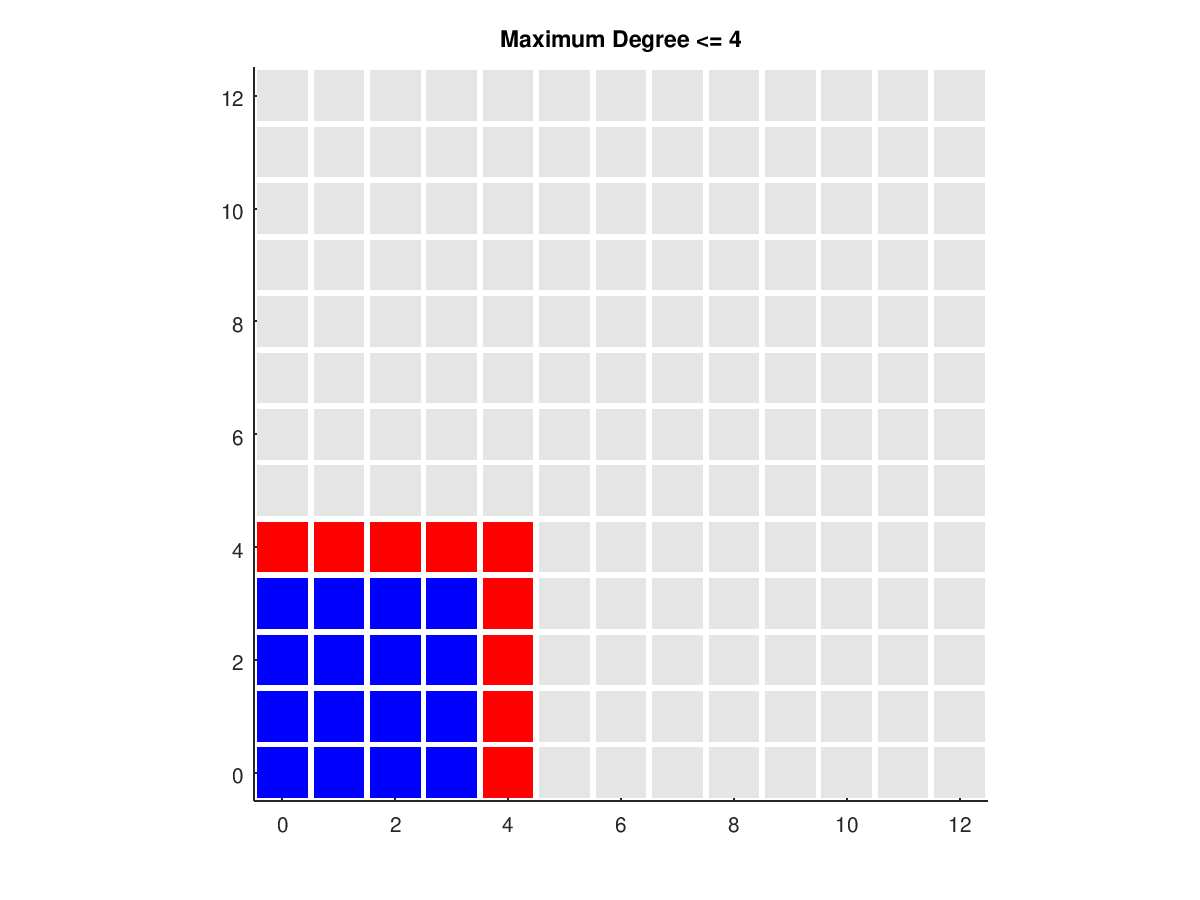
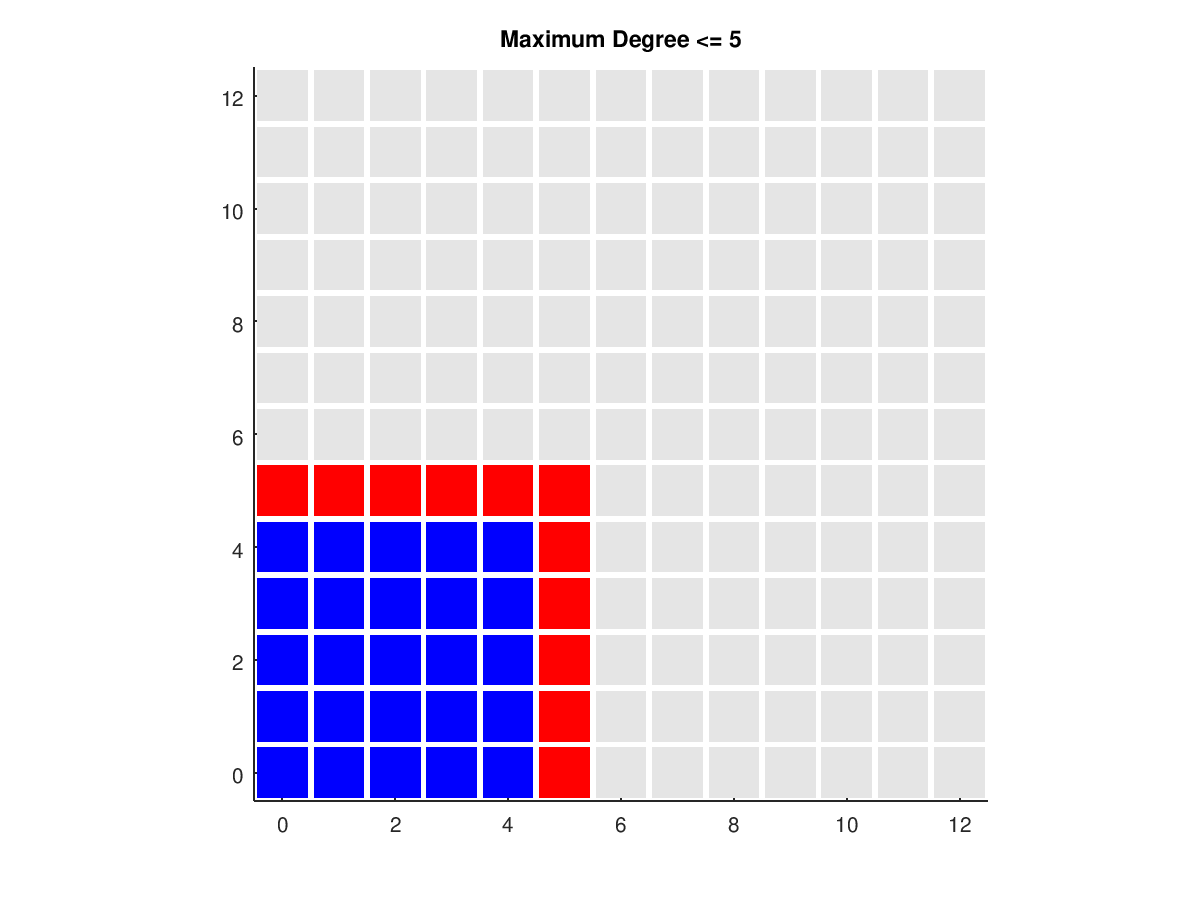
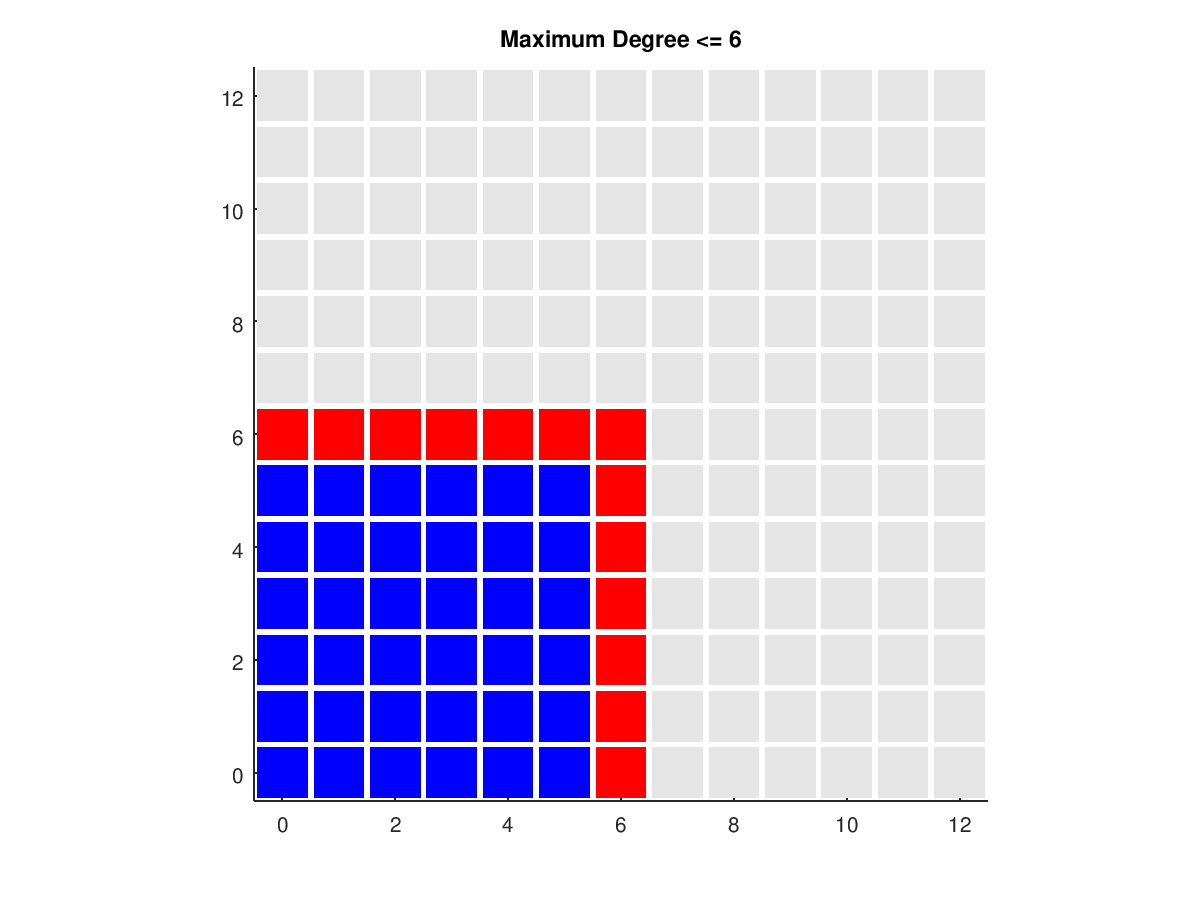
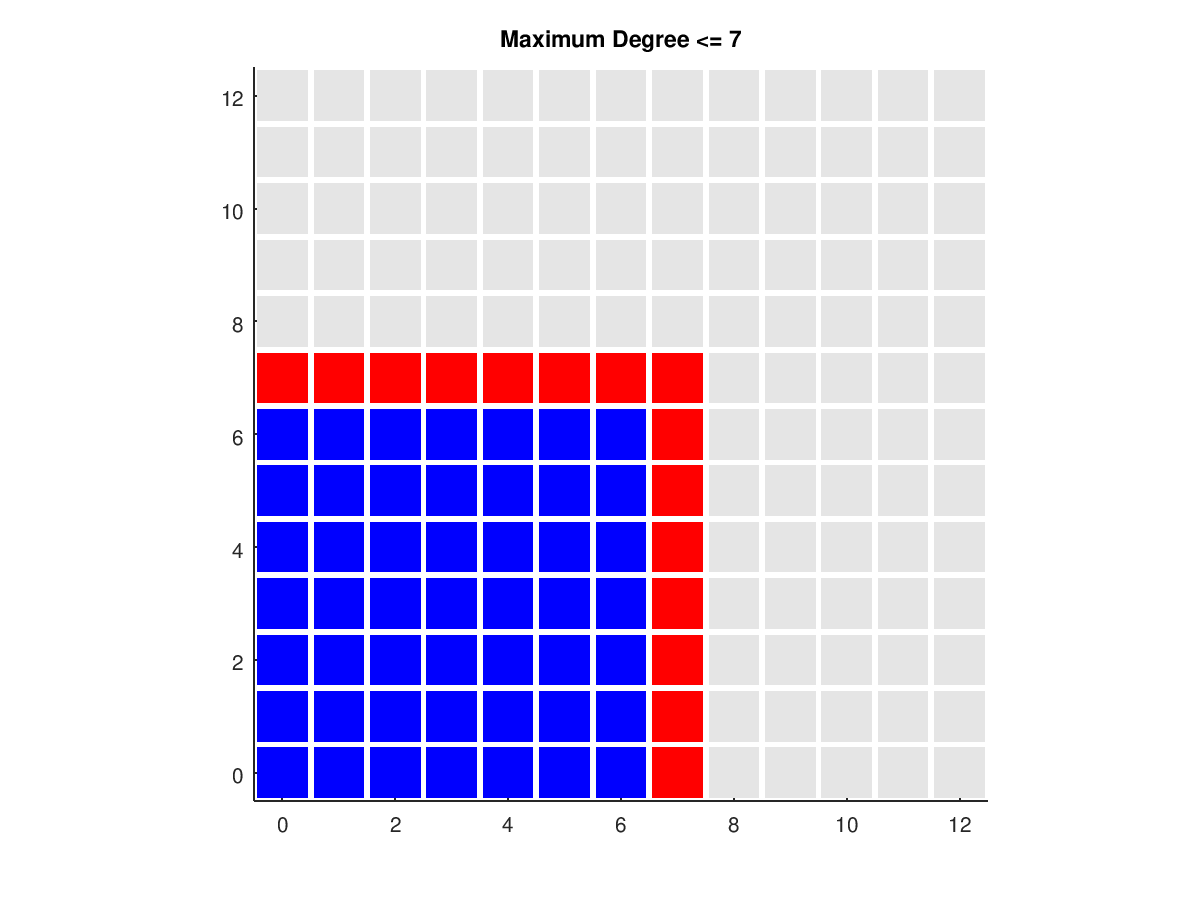
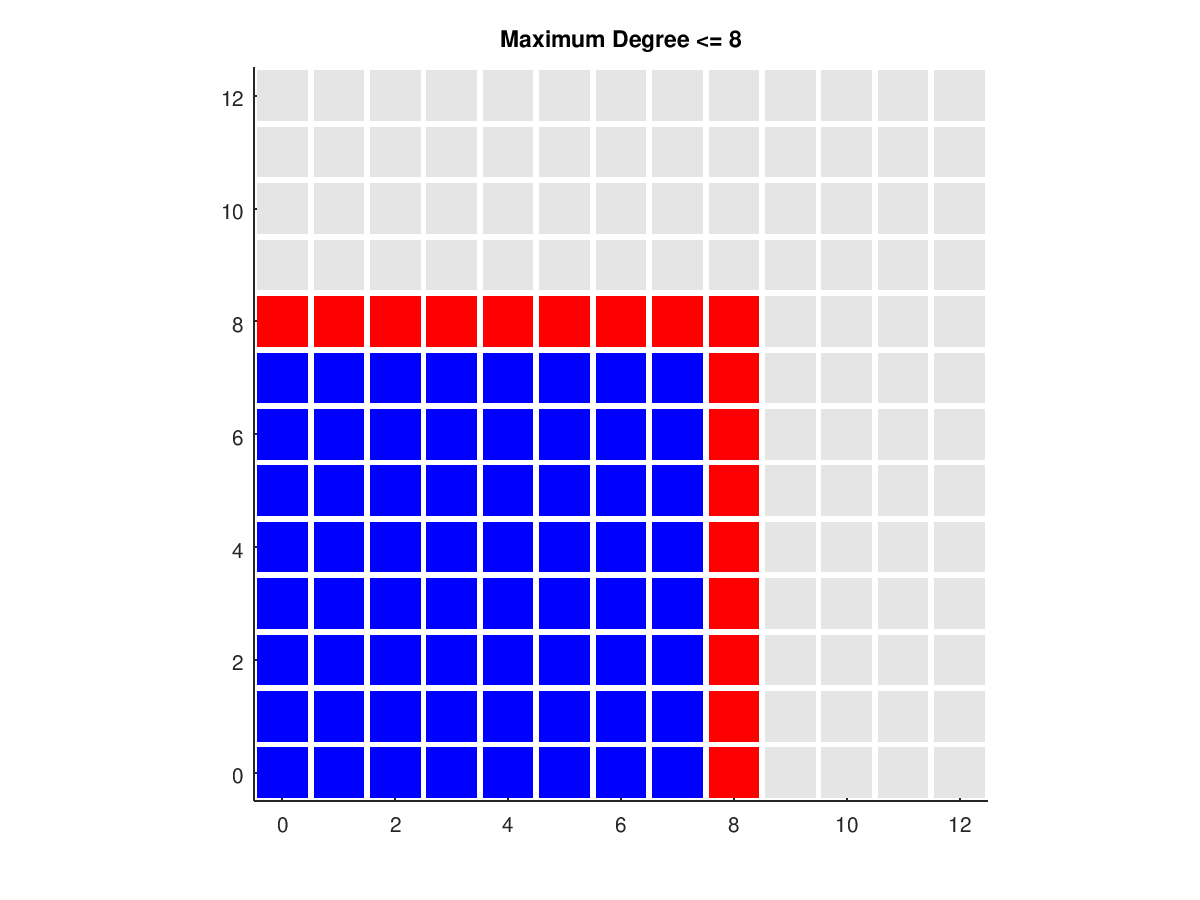
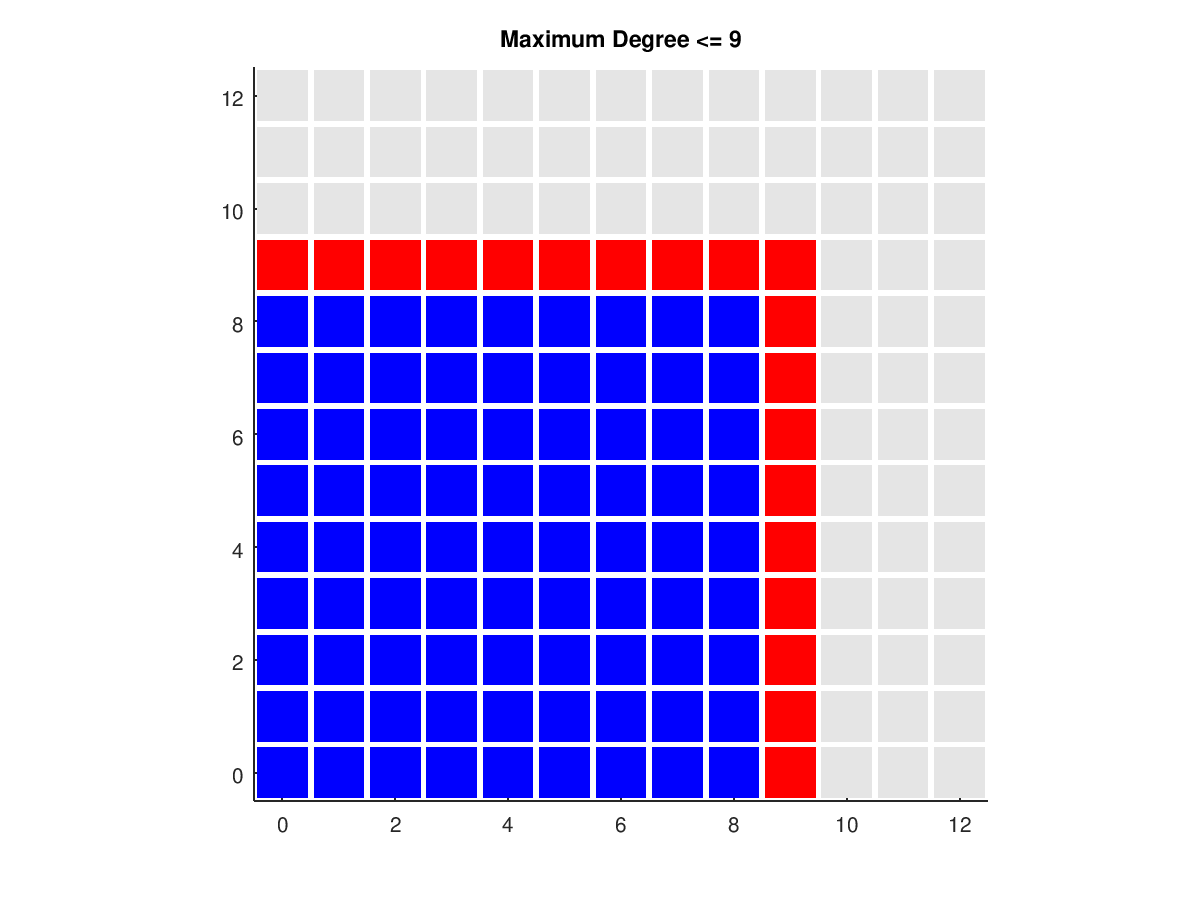
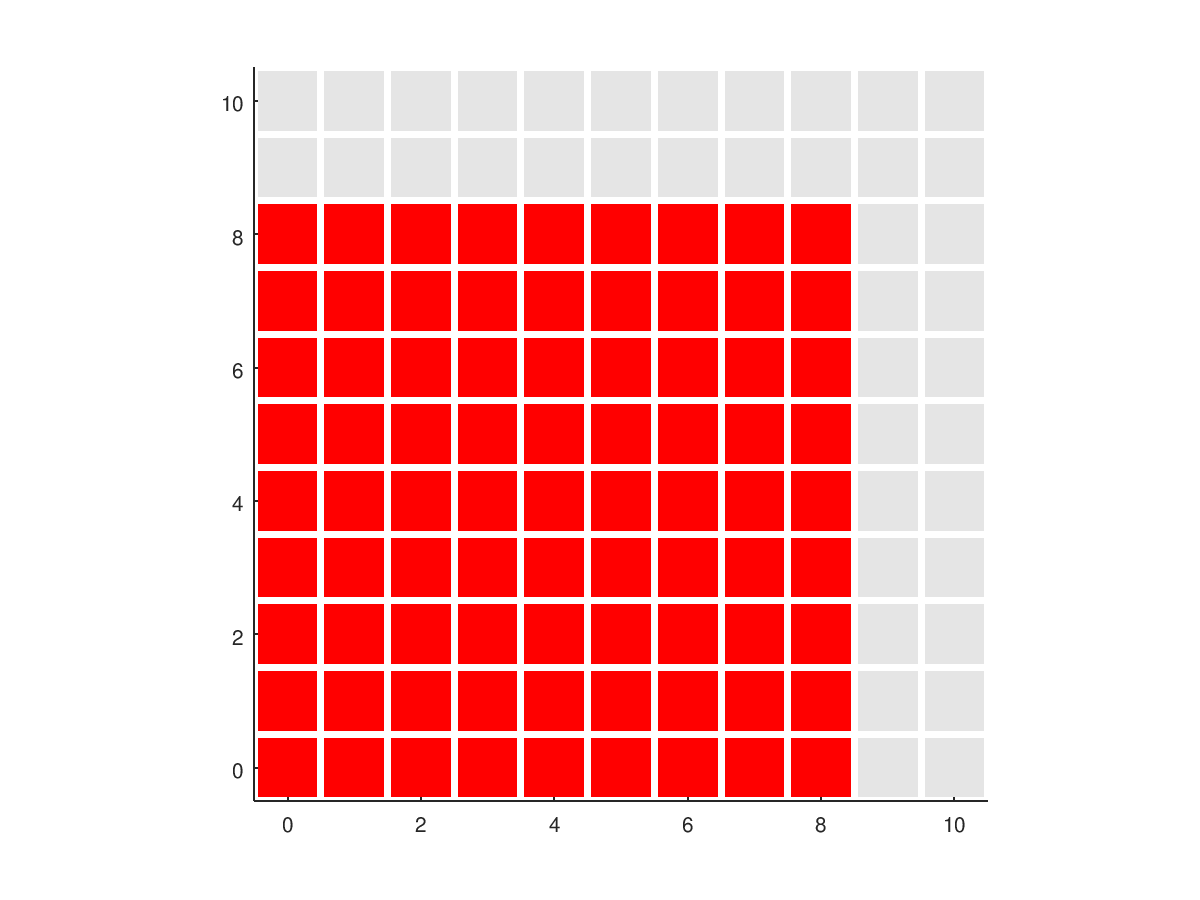
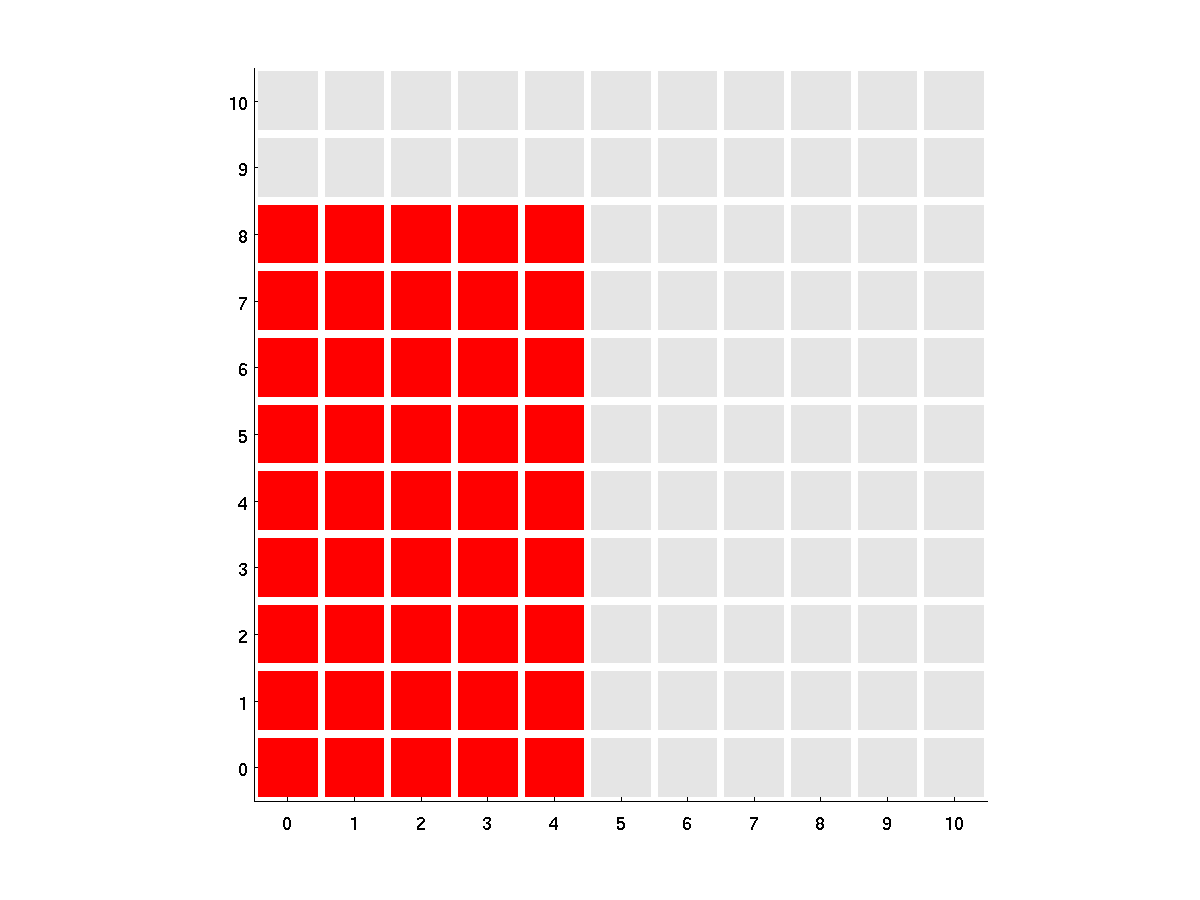
MD represents the maximum degree polynomials for which max ( D1, D2 ) <= L. Blue indicates "old" data, and red "new".
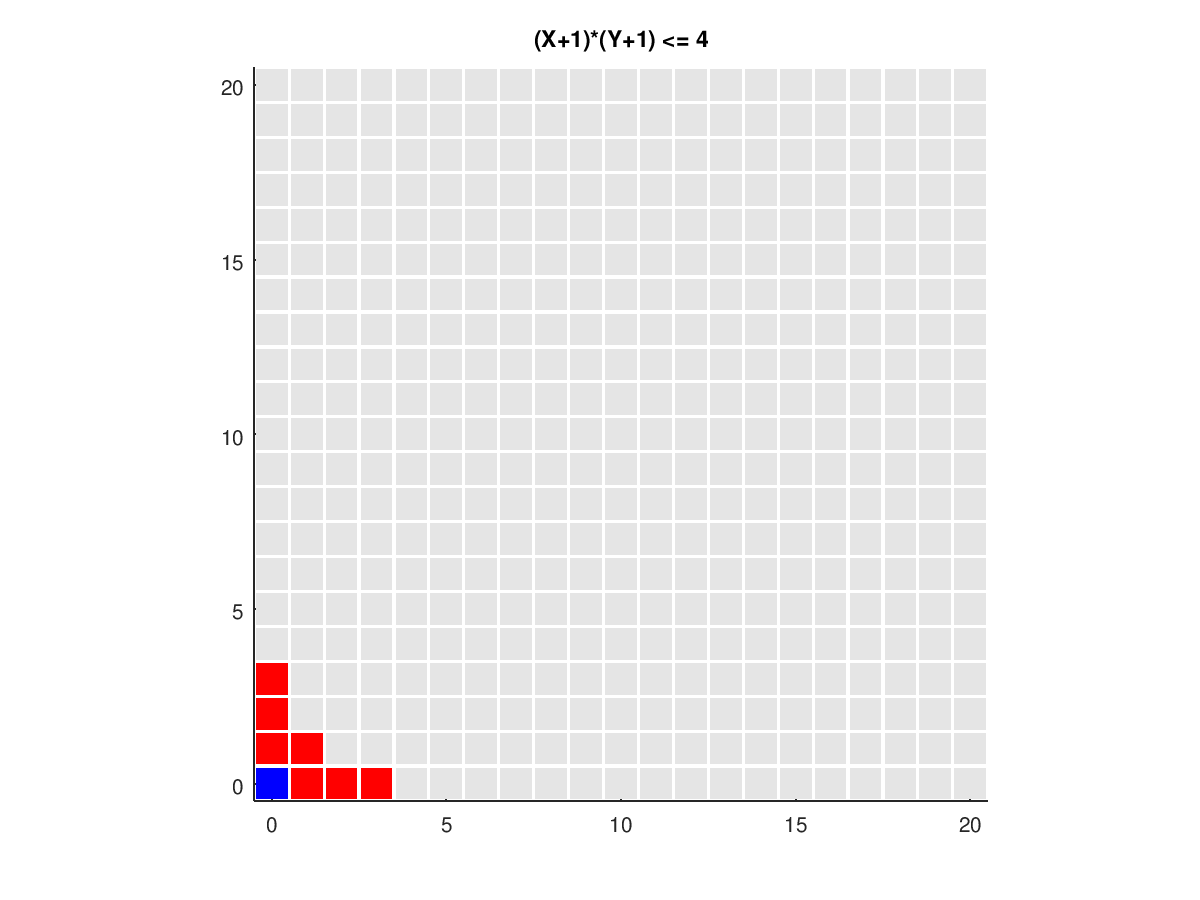
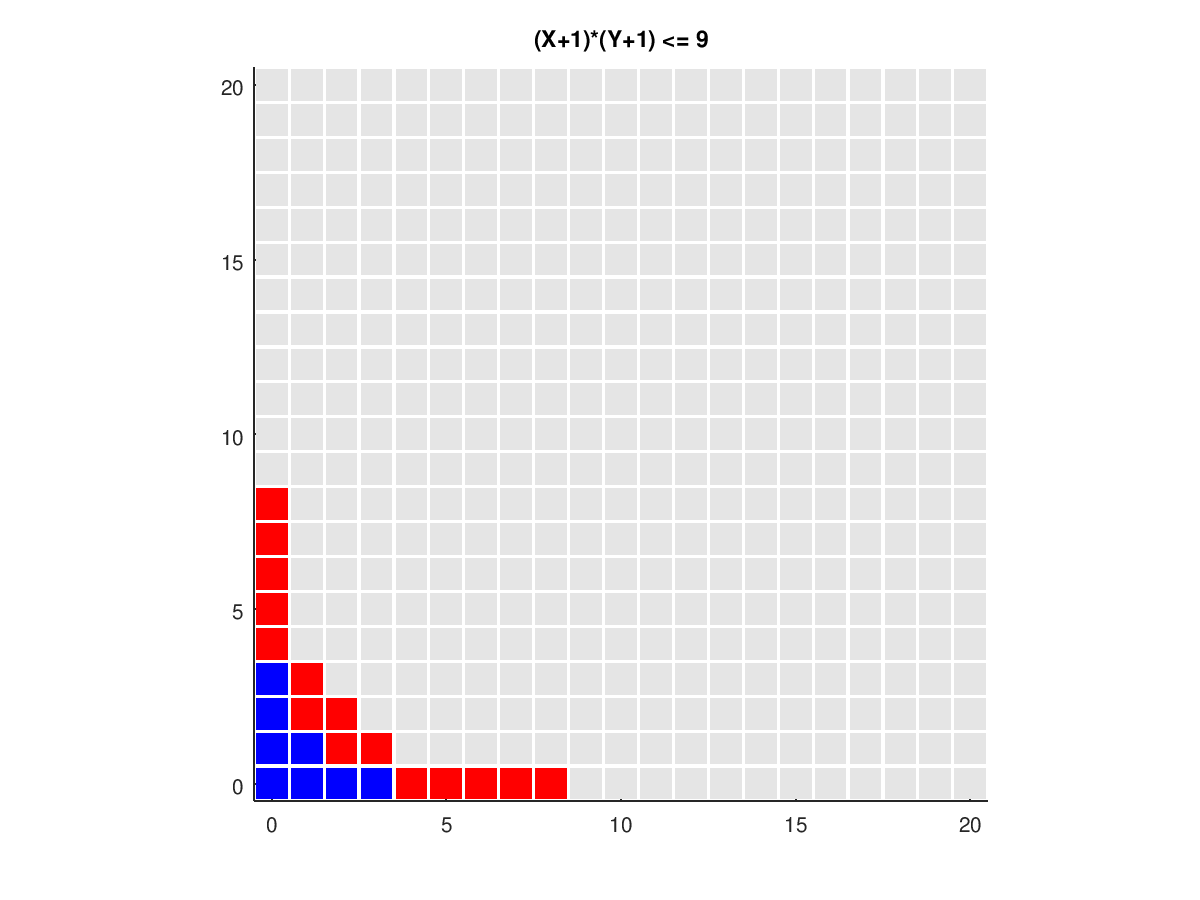
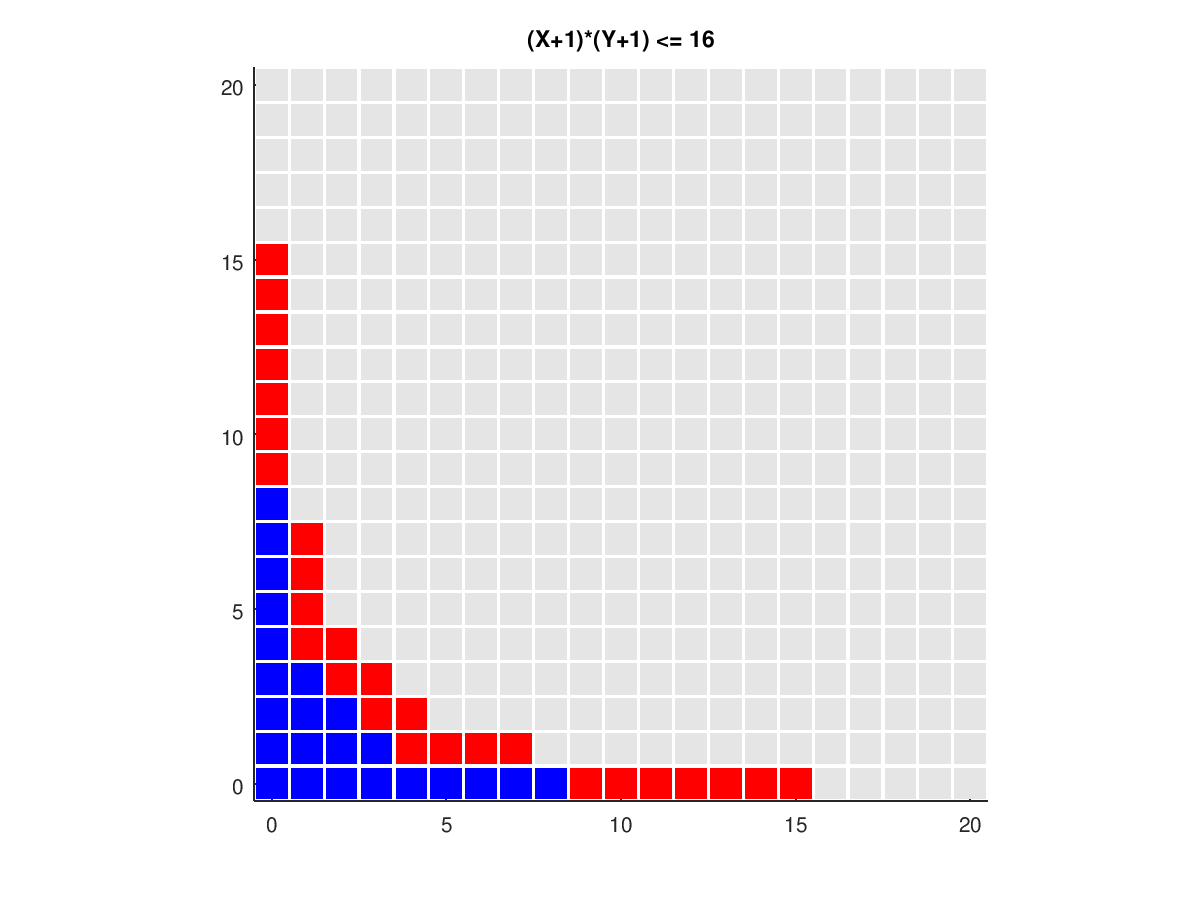
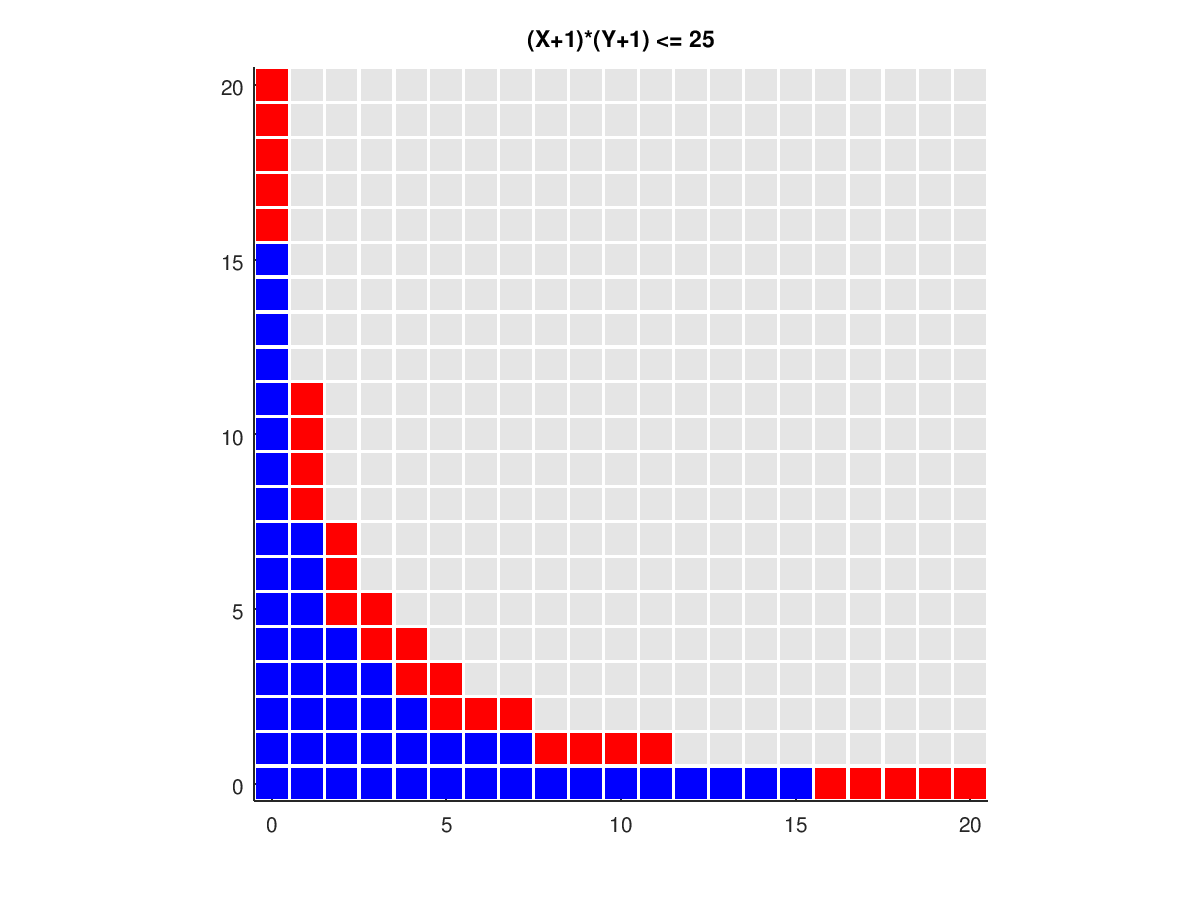
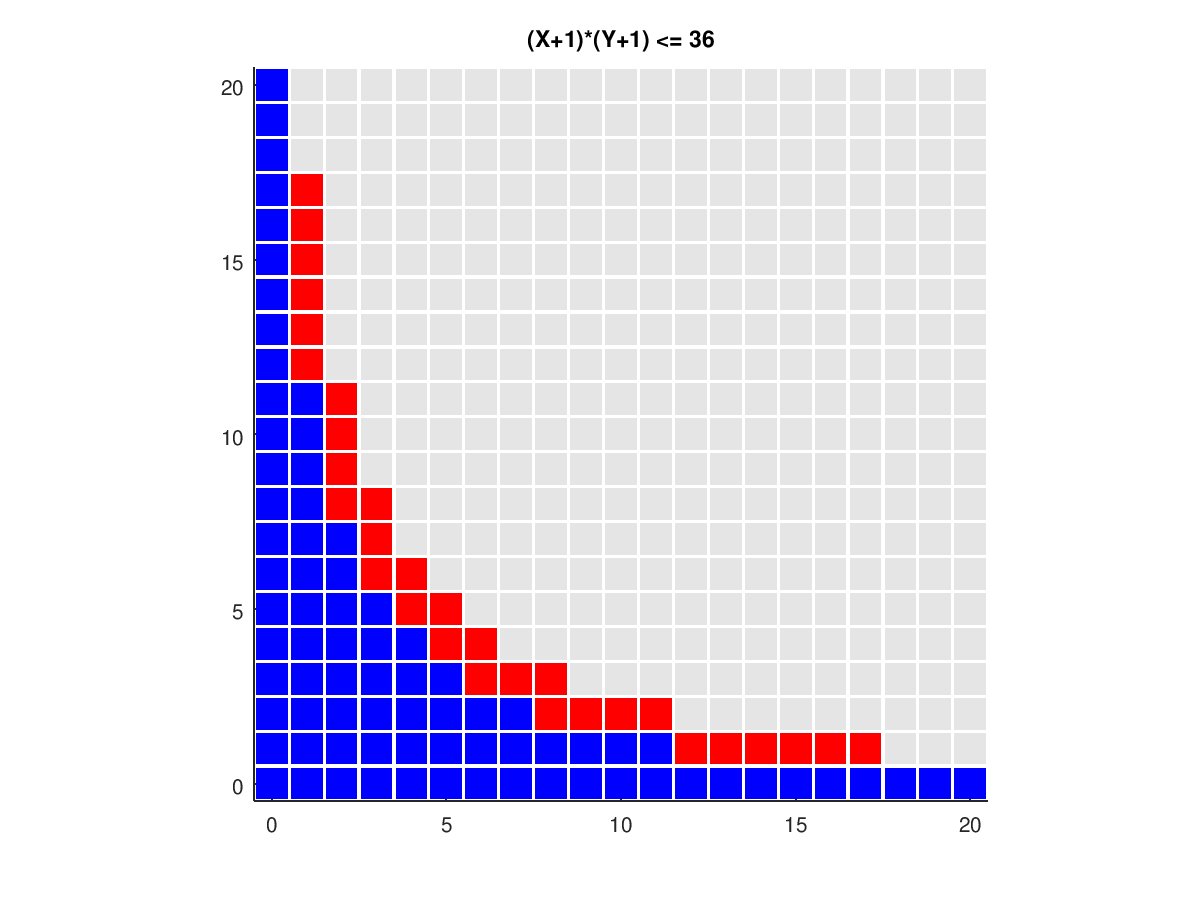
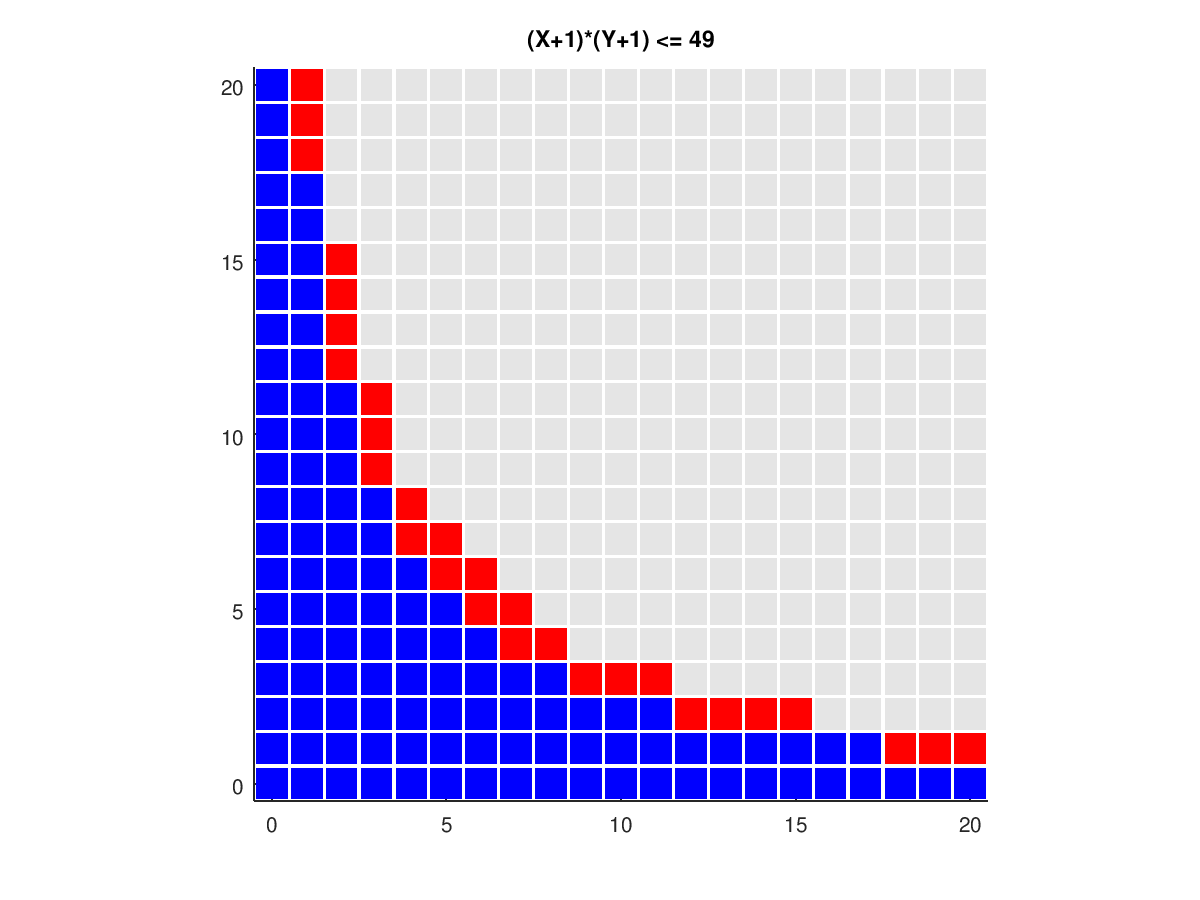
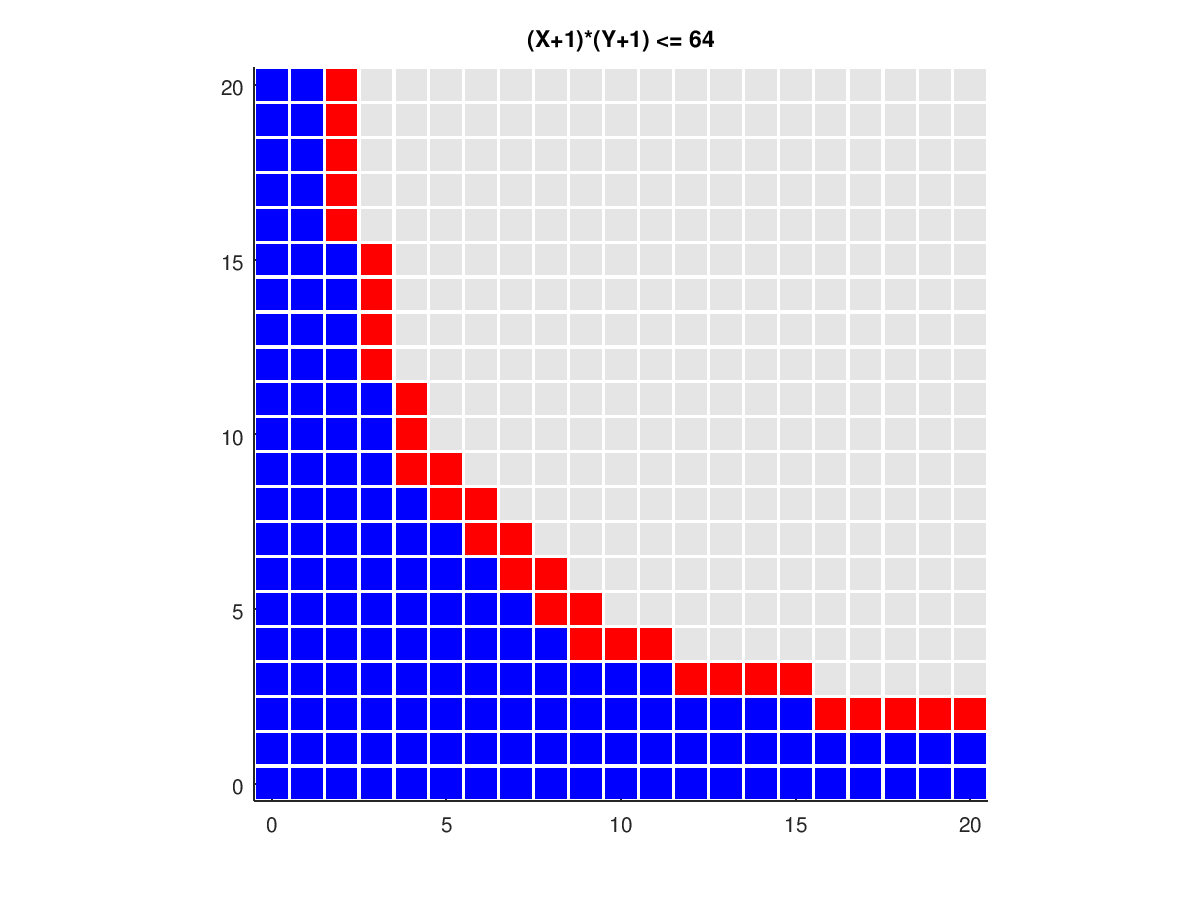
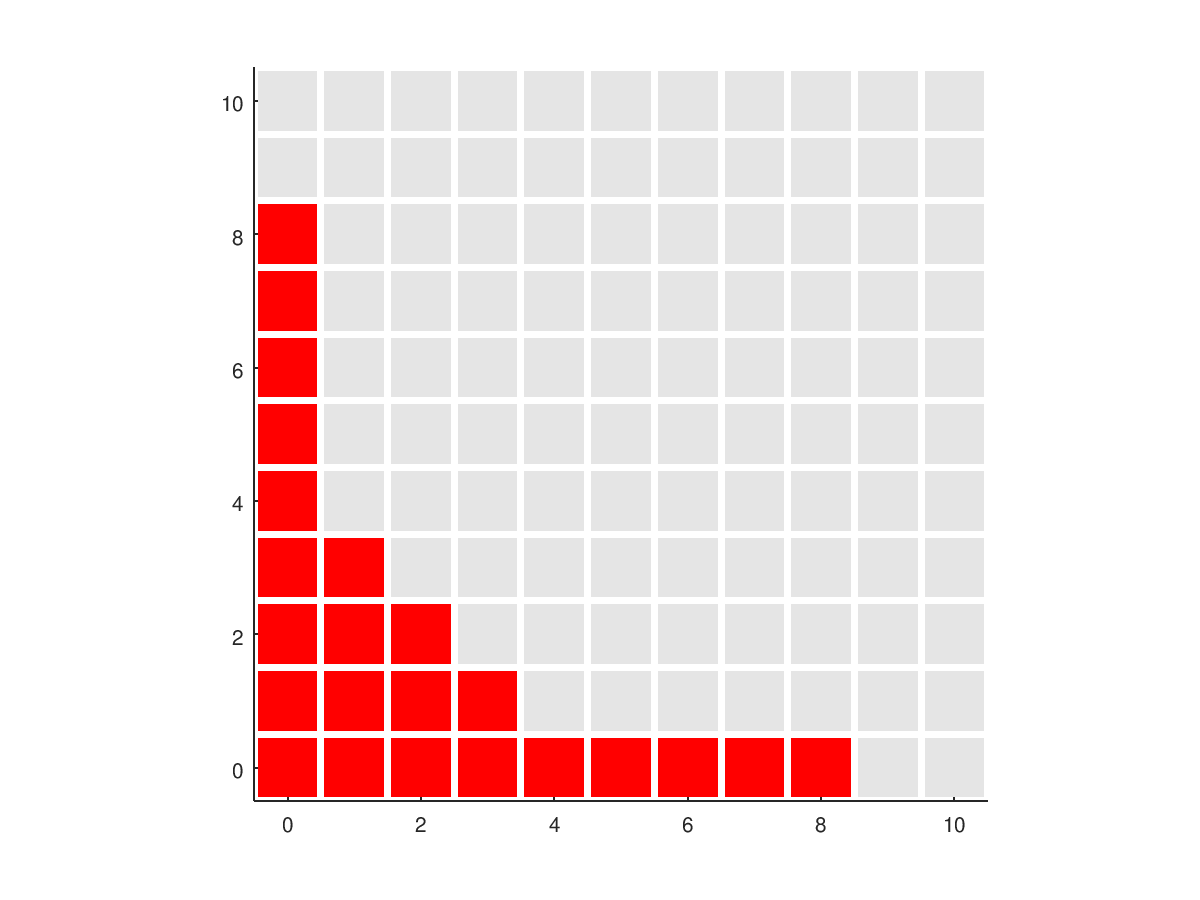
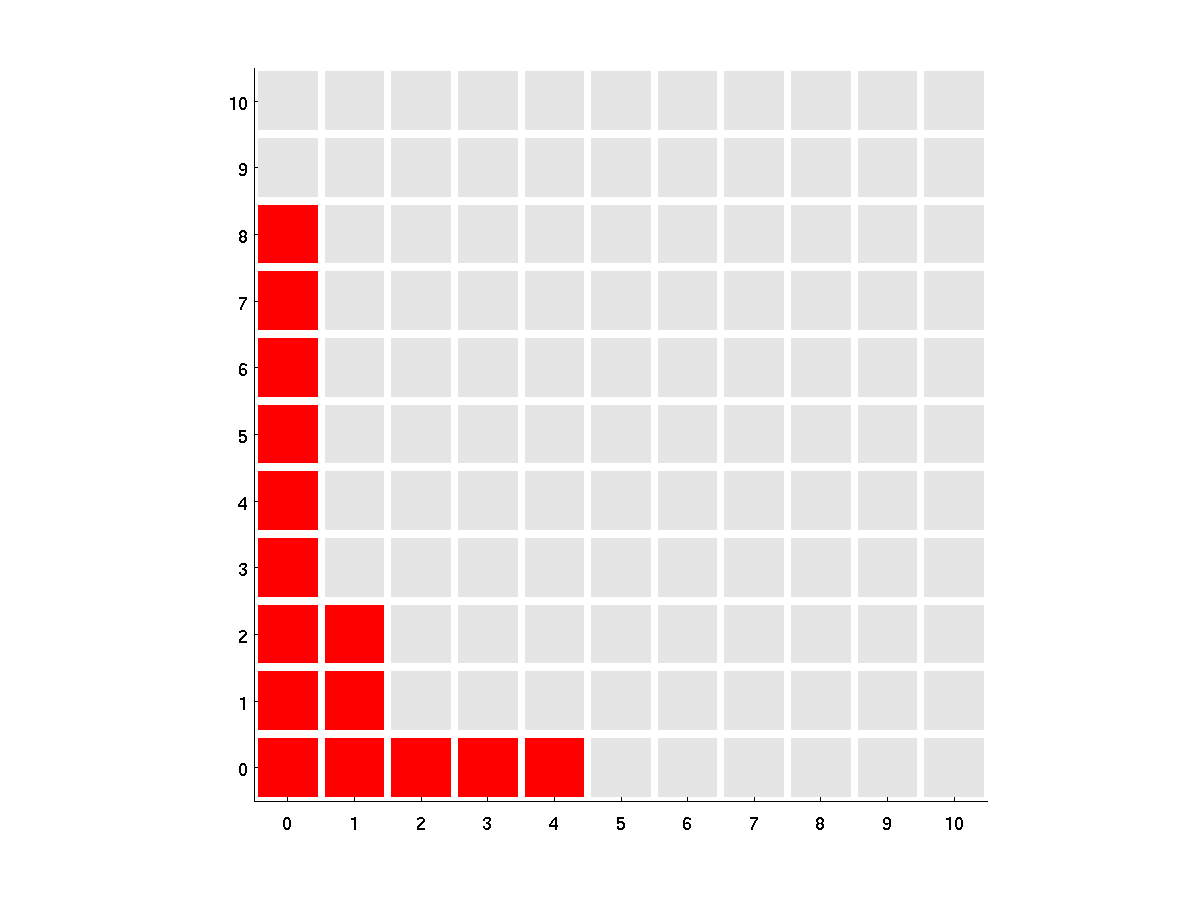
HC represents the hyperbolic cross polynomials for which (D1+1)*(D2+1) <= L. Blue indicates "old" data, and red "new".
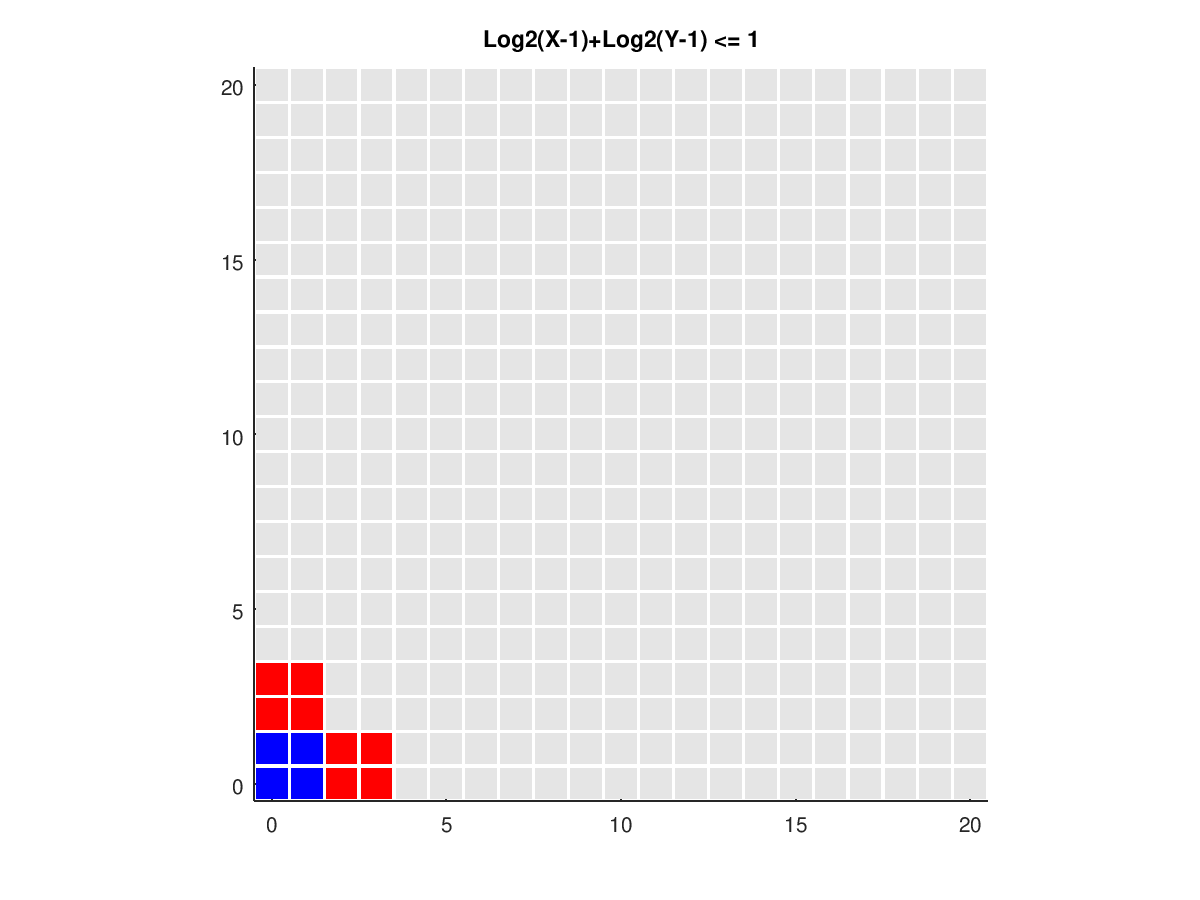
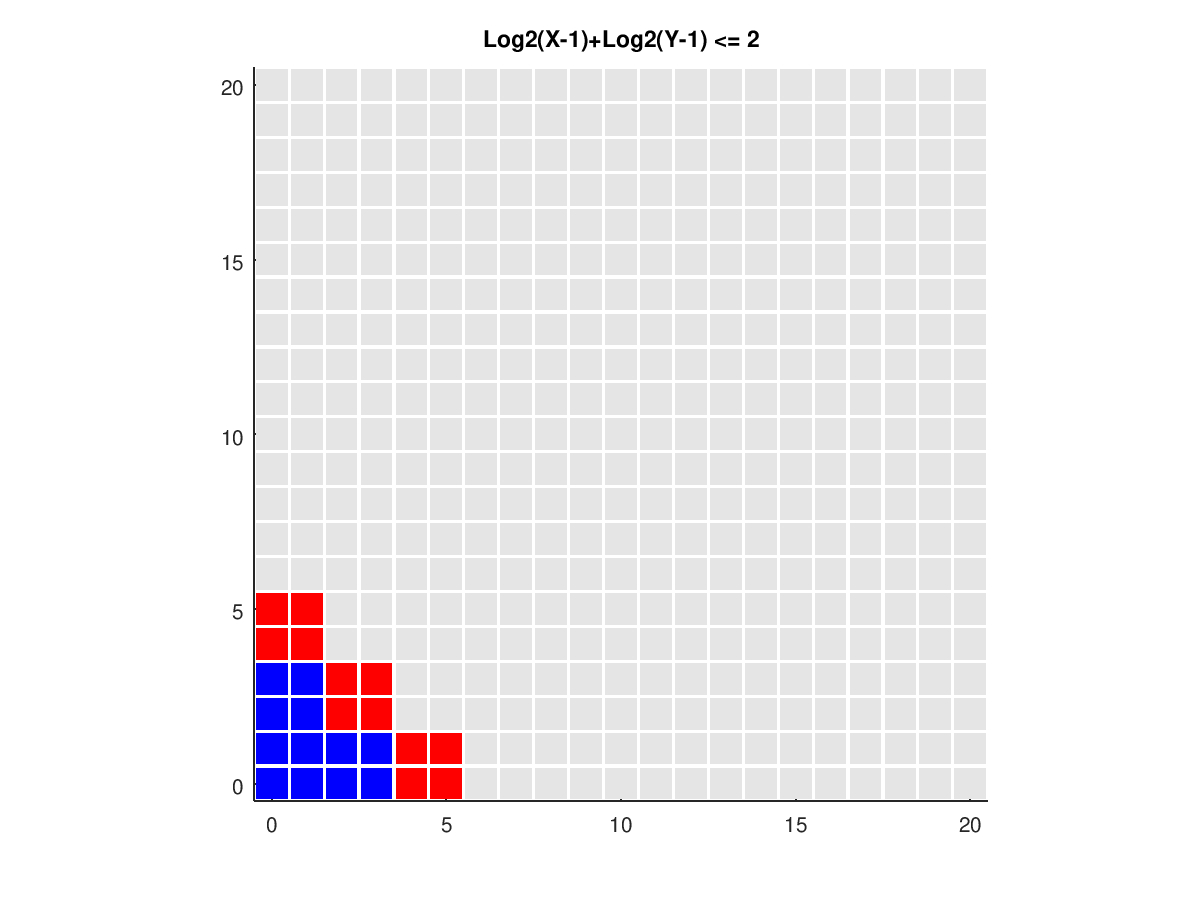
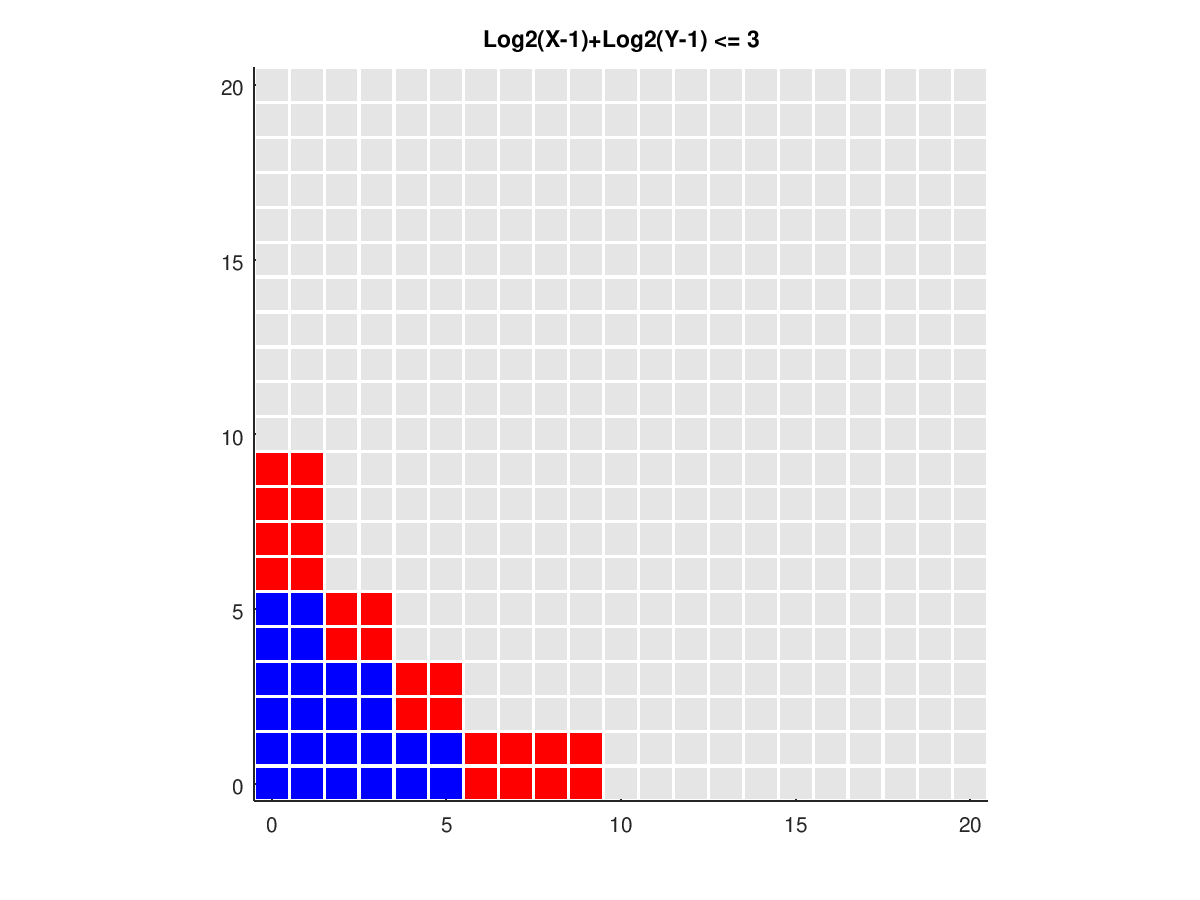
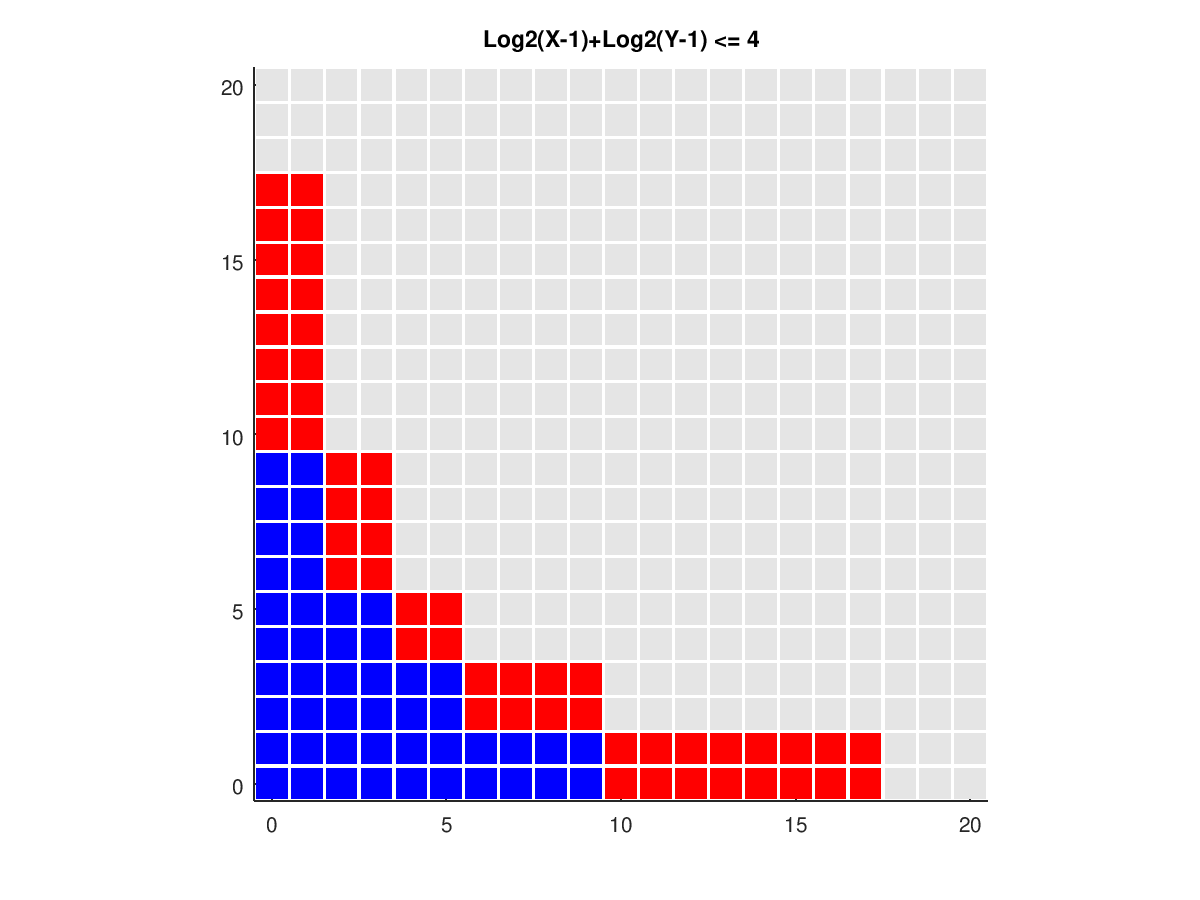
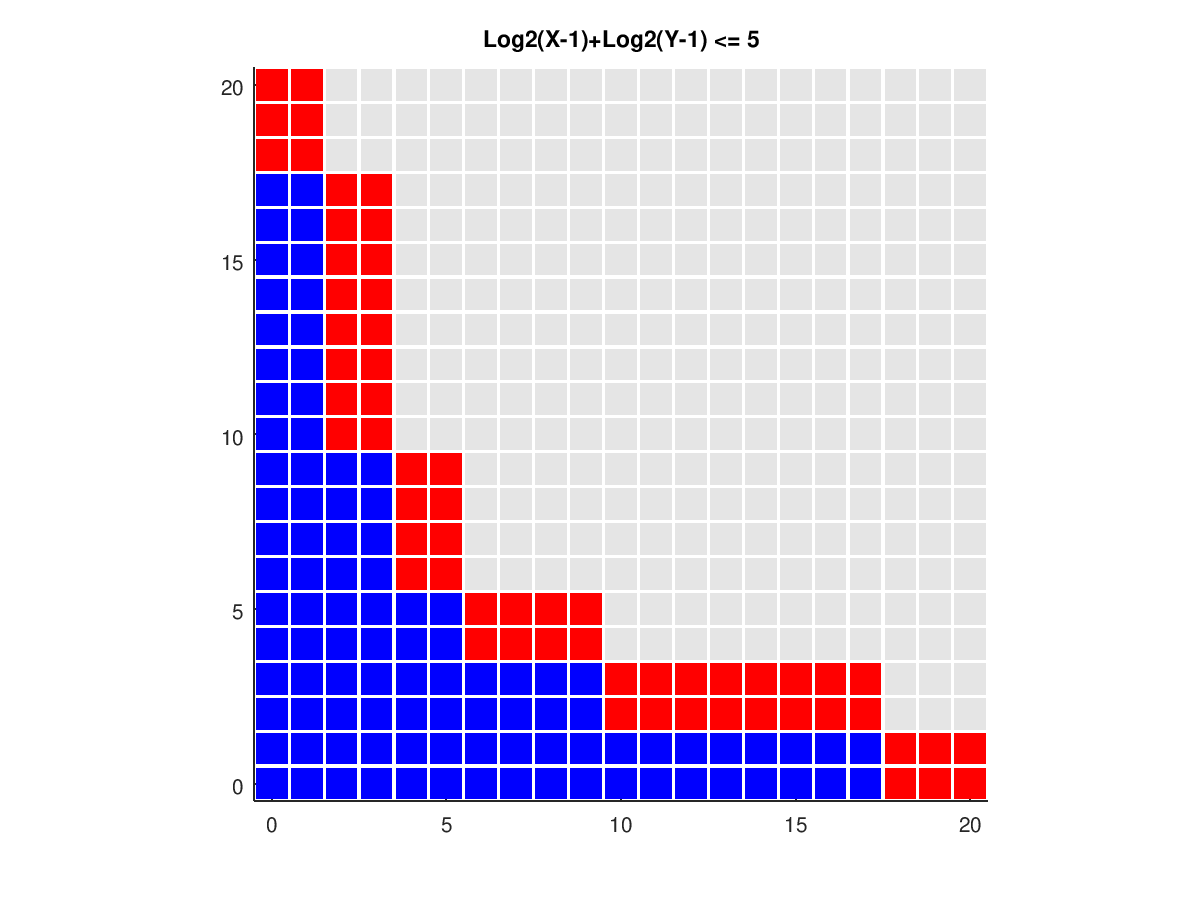
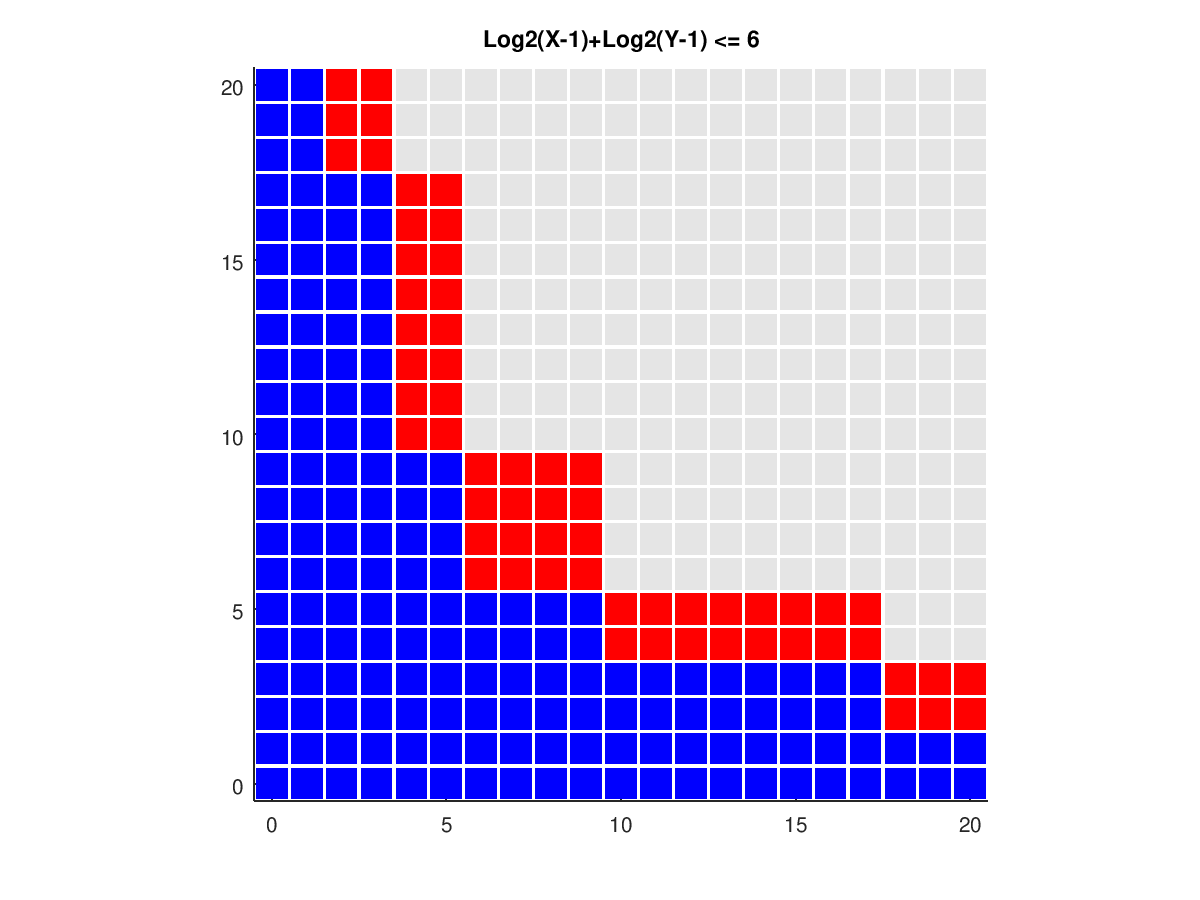
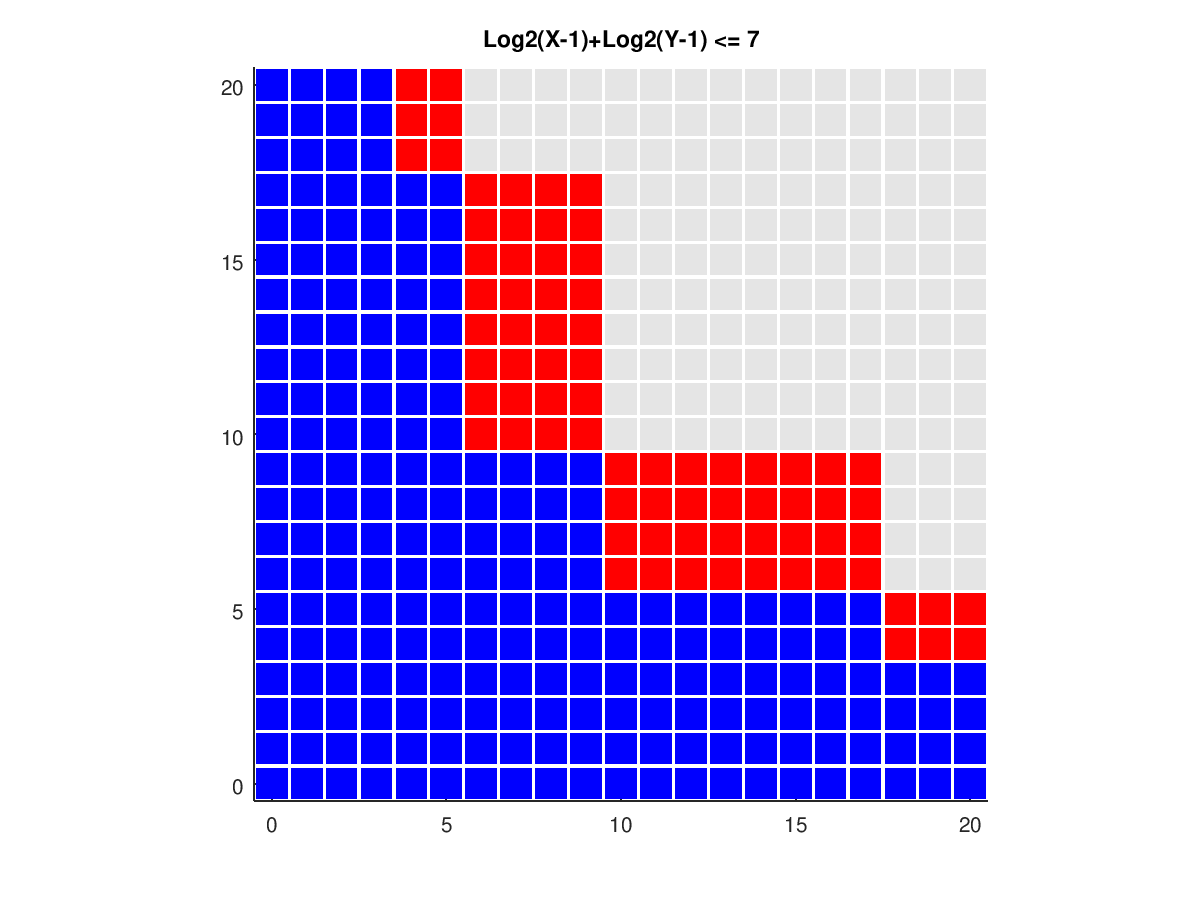
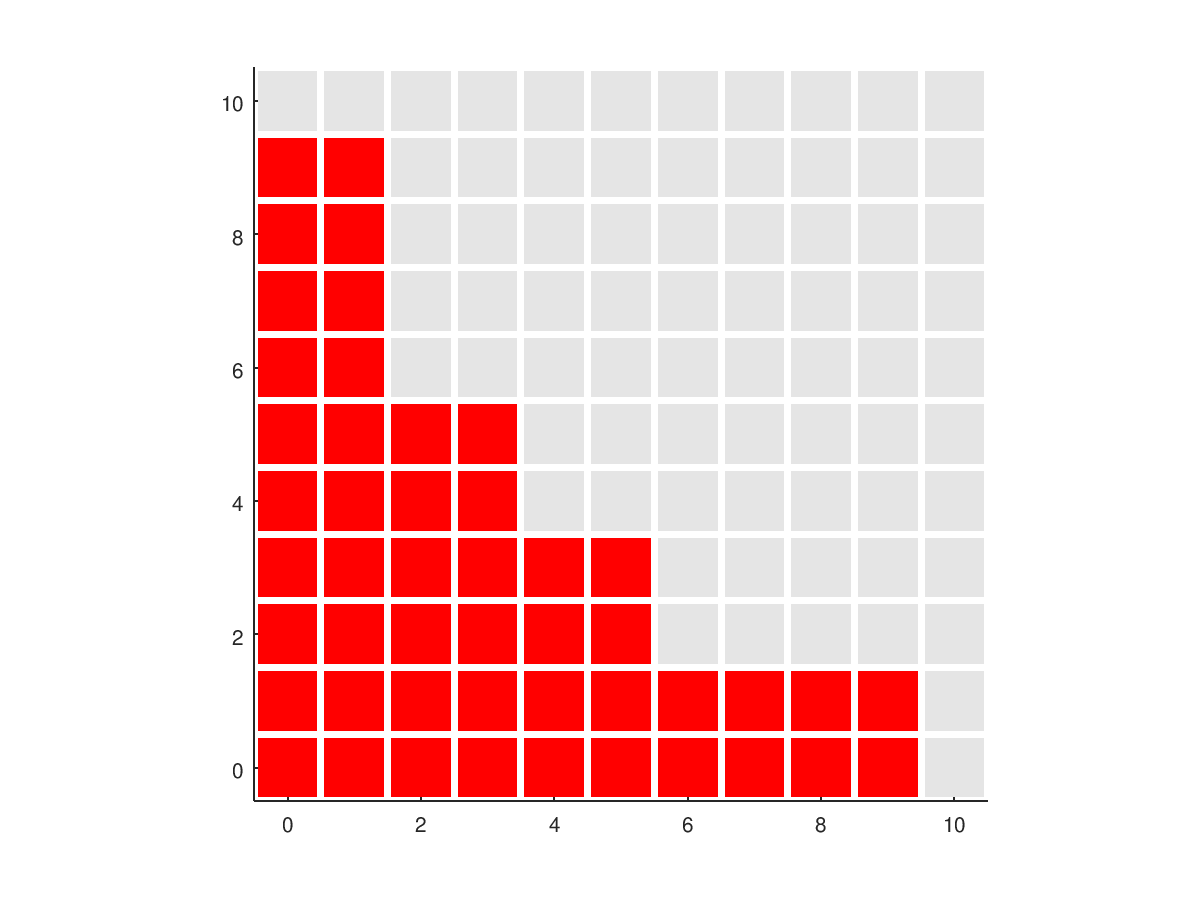
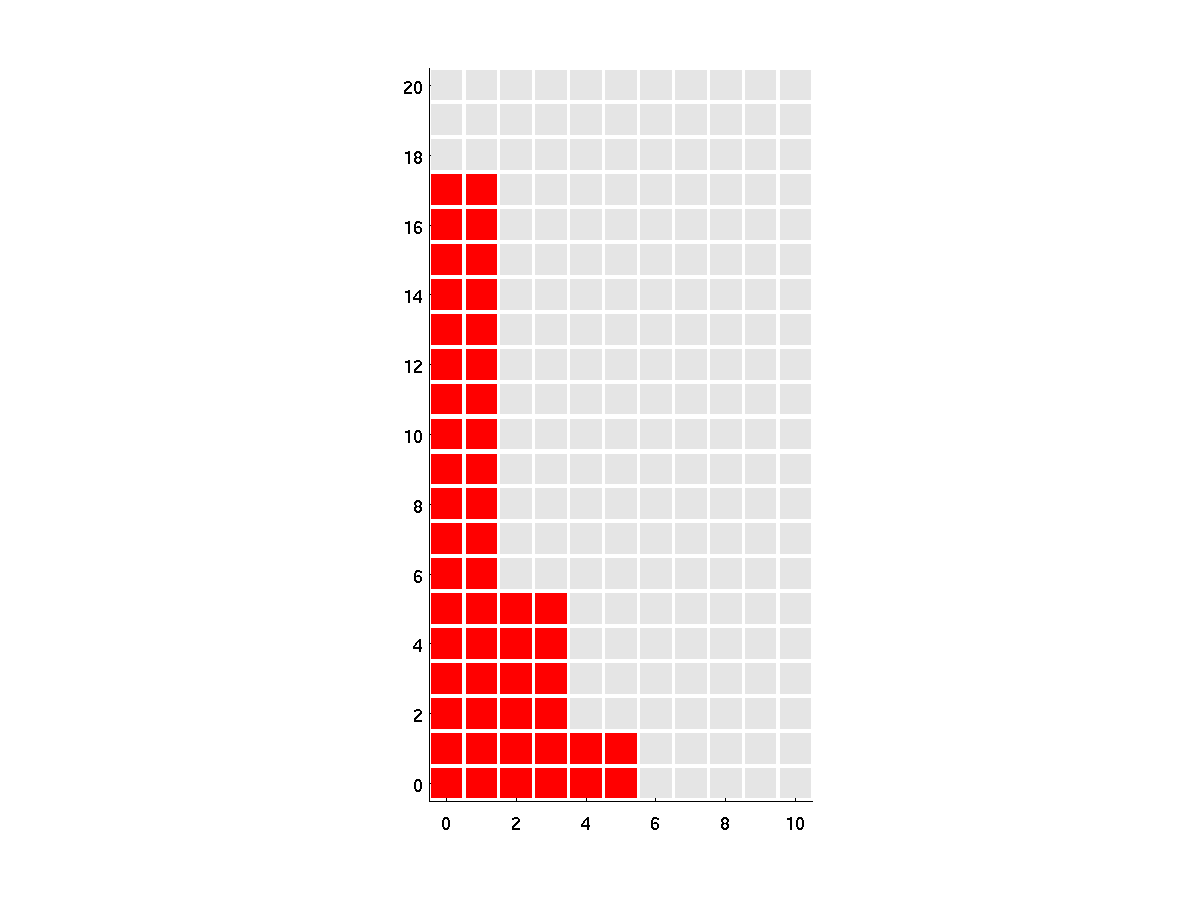
CC represents the Smolyak Clenshaw Curtis polynomials for which log2(D1-1)+log2(D2-1) <= L. Blue indicates "old" data, and red "new".
DEGREE8 represents the monomials precisely integrated by quadrature rules, assuming the quadrature rule is just powerful enough to integrate x^8 and y^8.
DEGREE48 represents the monomials precisely integrated by an anisotropic quadrature rule, assuming the quadrature rule is just powerful enough to integrate x^4 and y^8. Our anisotropy essentially weights the x exponent twice as much as y.