TASK: Use a transition model to simulate how 1000 customers switch their car insurance policies each year.
COMMENT: 1000 customers have a choice of three insurance companies, named (1) Awful, (2) Bogus, and (3) Cheapo. Insurance policies last one calendar year, and so every year, each customer must decide to renew a policy with the same company or switch to one of the other two choices.
Historical records have been kept, and so the probabilities of switching are known, and can be represented by a probability matrix P:
              This Year
            A     B     C
         -----------------
Next   A | 0.75, 0.10, 0.05
Year   B | 0.15, 0.50, 0.35
       C | 0.10, 0.40, 0.60
For instance, if you have A insurance this year, there's P(1,1)=0.75 probability
you will renew it, a P(2,1)=0.15 probability you will switch to company B from A,
and a P(3,1)=0.10 chance of switching to company C from A.
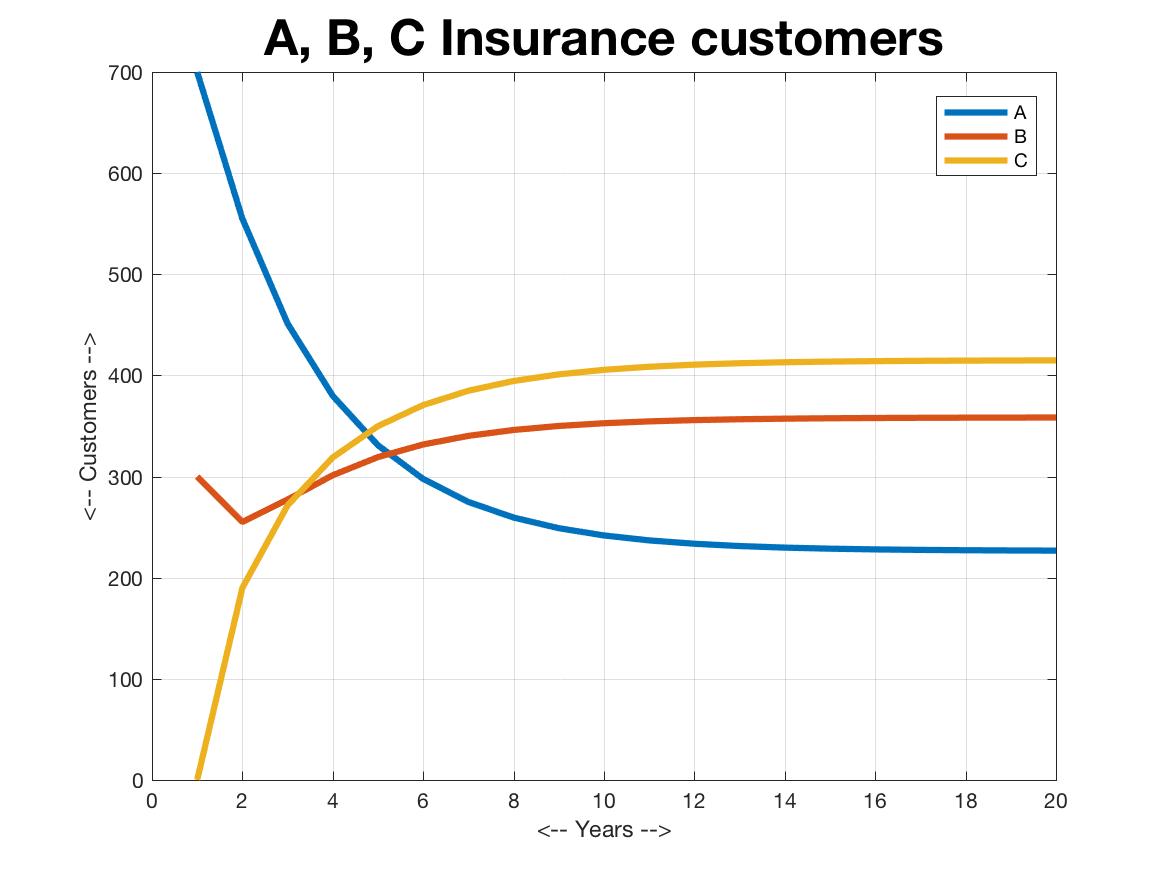
Suppose that this year, there are 700 A customers, 300 B customers, and 0 C customers. Simulate the distribution of policies over 20 years.
INSTRUCTIONS:
        m = number of years
        A, B, C = row vectors of m columns
        loop i from 1 to m
          if i is 1,
            initialize A(1), B(1), C(1)
          else
            A(i) = P(1,1) * A(i-1) + P(1,2) * B(i-1) + P(1,3) * C(i-1)
            B(i) = ?
            C(i) = ?
          end
        end
        plot ( 1:m, A, 1:m, B, 1:m, C )
CHECK:
You might get something like this. I used the legend('A','B','C') command
to connect the line colors to A, B, and C:
SUBMIT: Your file should be named "hw055.m", and begin with:
        % hw055.m
        % YOUR NAME
        % This script (describe what it does)