TASK: Use the contour() function to plot an ellipse.
COMMENT: Consider the function
f(x,y) = 2 x^2 + 3 x y + 6 y^2 + 7 x - 5 y + 10
This function defines a family of nested ellipses. Our goal is to
use the contour() function to plot some of these ellipses. We need to choose
the plotting region carefully, so that it includes the "center" of
the ellipses.
To be clear, the difficult part of this exercise is choosing the range of x and y so that your contour plot includes the center point around which the ellipses are drawn.
INSTRUCTIONS:
        % You will have to run the program, look at your plot, and then
        % change xvec and yvec a few times, until you "capture" the center
        % of the ellipses.
        %
        xvec = perhaps start with the range 0 to +1;
        yvec = perhaps start with the range 0 to +1;

        [ X, Y ] = make tables from xvec and yvec
        Z = evaluate the function
        contour(X,Y,Z);

        % Include the ellipse function in your script:

        function Z = f(X,Y)
          Z = ?
          return
        end
CHECK:
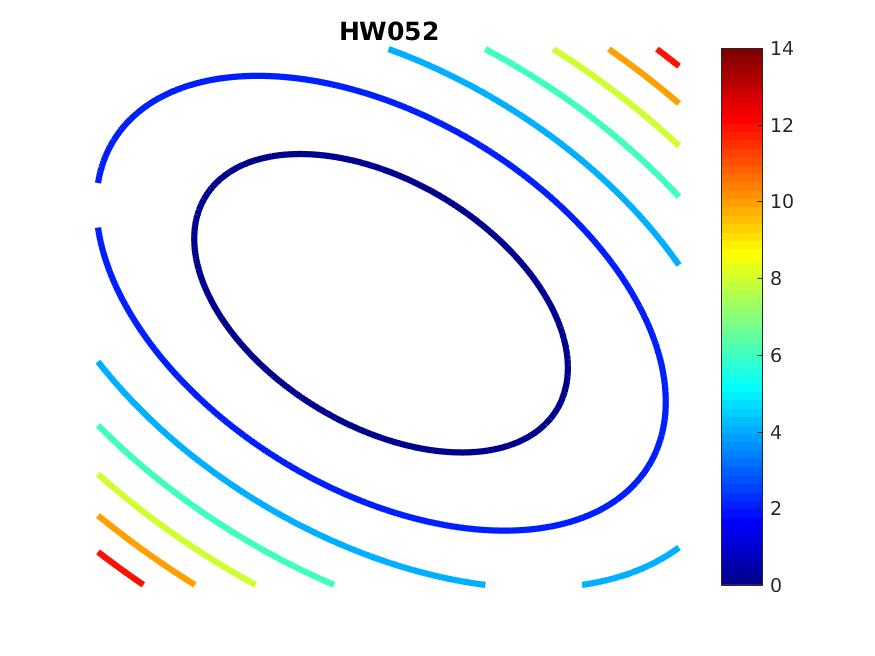
You might get something like this. It's important that you pick your xvec
and yvec values so that your plot includes
a complete ellipse:
SUBMIT: Your script file should be named "hw052.m", and begin with:
        % hw052.m
        % YOUR NAME
        % This script (describe what it does)
I do not need a copy of your plot.