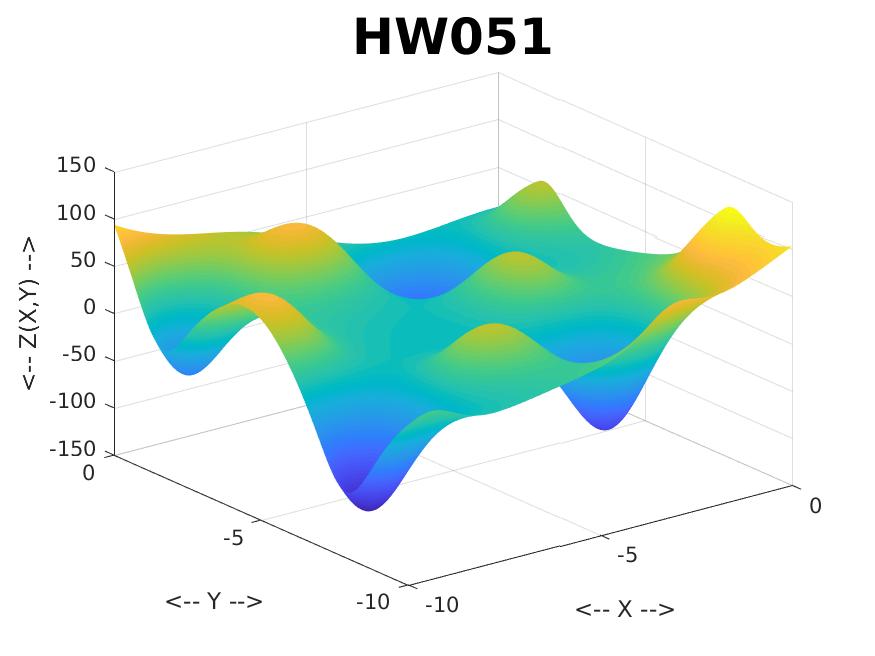
TASK: Create a surface plot of a function that includes a number of depressions.
COMMENT: Consider the function
f(x,y) = sin(y)*e^(1-cos(x))^2 + cos(x)*e^(1-sin(y))^2 + (x-y)^2
This is another example of a function where we might be interested in
looking for minimum values. If we plot it over [-10,0]x[-10,0],
we may see one or more depressions that correspond to minimum values.
We'll create a surface plot this time.
INSTRUCTIONS:
        xvec = go between -10 and 0
        yvec = go between -10 and 0
        [ X, Y ] = make tables from xvec and yvec
        Z = evaluate the function

        call surf

        If you want, you can get rid of the black marker lines on the surface
        by adding the inputs ", 'EdgeColor', 'None' )" to your call to surf.

        function Z = ...include function f in your script
          Z = ?
          return
        end
When the plot is displayed, you can used the "Rotate 3D" menu item,
the little circular arrow to the right of the "Hand" item, to rotate
the surface and get a better look.
CHECK:
You might get something like this:

SUBMIT: Your script file should be named "hw051.m", and begin with:
        % hw051.m
        % YOUR NAME
        % This script (describe what it does)
I do not need a copy of your plot.