TASK: Write a function which makes a bin plot of the results of tossing n dice m times.
COMMENT: A single die has faces labeled 1, 2, 3, 4, 5, 6. If we roll a die m times, we expect to see the scores 1 through 6 roughly an equal number of times. We can check this with a MATLAB simulation, setting up an array "bin" of size 6. Each time we get a particular score, we add 1 to the corresponding bin:
        d = randint ( [ 1, 6 ] );
        score = d;
        bin(score) = bin(score) + 1;
and after we have done "m" tosses, we can display the results by
the command
bar ( 1:6, bin );
If we roll 2 dice, then our maximum possible score is 12. We can set up an array "bin" of size 12. We can roll two dice by writing
        d = randint ( [ 1, 6], ( 1, 2 ) );
        score = sum ( d );
        bin(score) = bin(score) + 1;
and after we have done "m" tosses, we can display the results by
the command
bar ( 1:12, bin );
INSTRUCTIONS: write a function "hw046" that takes as input the value n, for the number of dice to be used. It then simulates rolling "n" dice, computes the score, and updates a bin array. It does this m=1000 times. Finally, it displays a bar plot of the results.
        Write the function header with no output, the function name,
        and the input "n".

          Set up your "bin" array using the zeros() function.

          for 1000 times
            roll n dice
            compute the score
            increment the appropriate bin entry

          display the results as a bar plot.

          return
        end
CHECK:
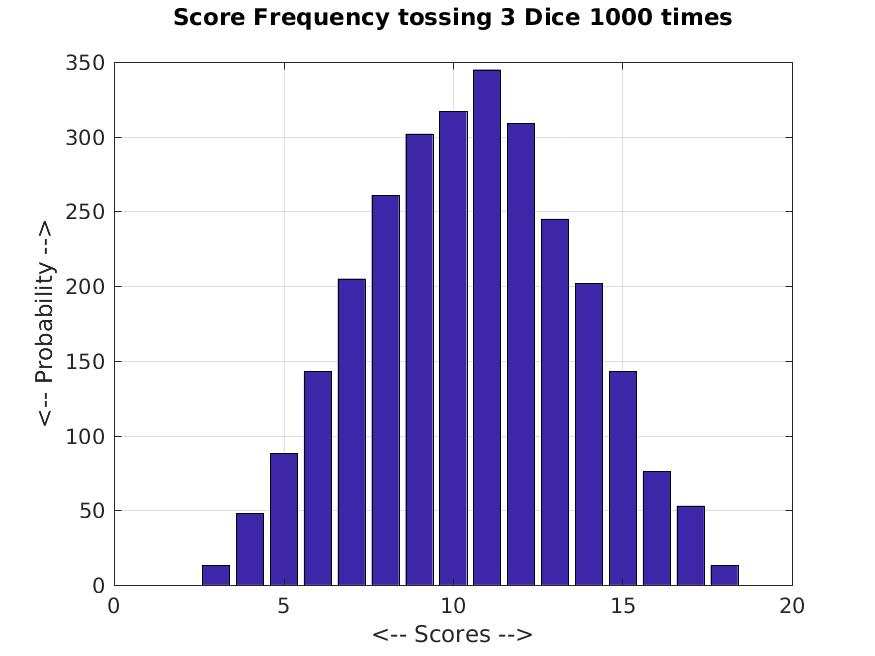
n = 3;
hw046 ( n );
You should get something like this:

SUBMIT: Your script file should be named "hw046.m", and begin with:
        % hw046.m
        % YOUR NAME
        % This script (describe what it does)
I do not need a copy of your plots.