6th Funky Function:
A function that is continuous everywhere
but nowhere differentiable.
| > |
Take a Weierstrass Function
f(x) = ![]() sin (
sin ( ![]() π x)
π x)
for some fixed constants a and b
where 0 < a < 1 and ab ≥1 .
Consider the partial sums of f,
S_n (x) = ![]() sin (
sin ( ![]() π x) .
π x) .
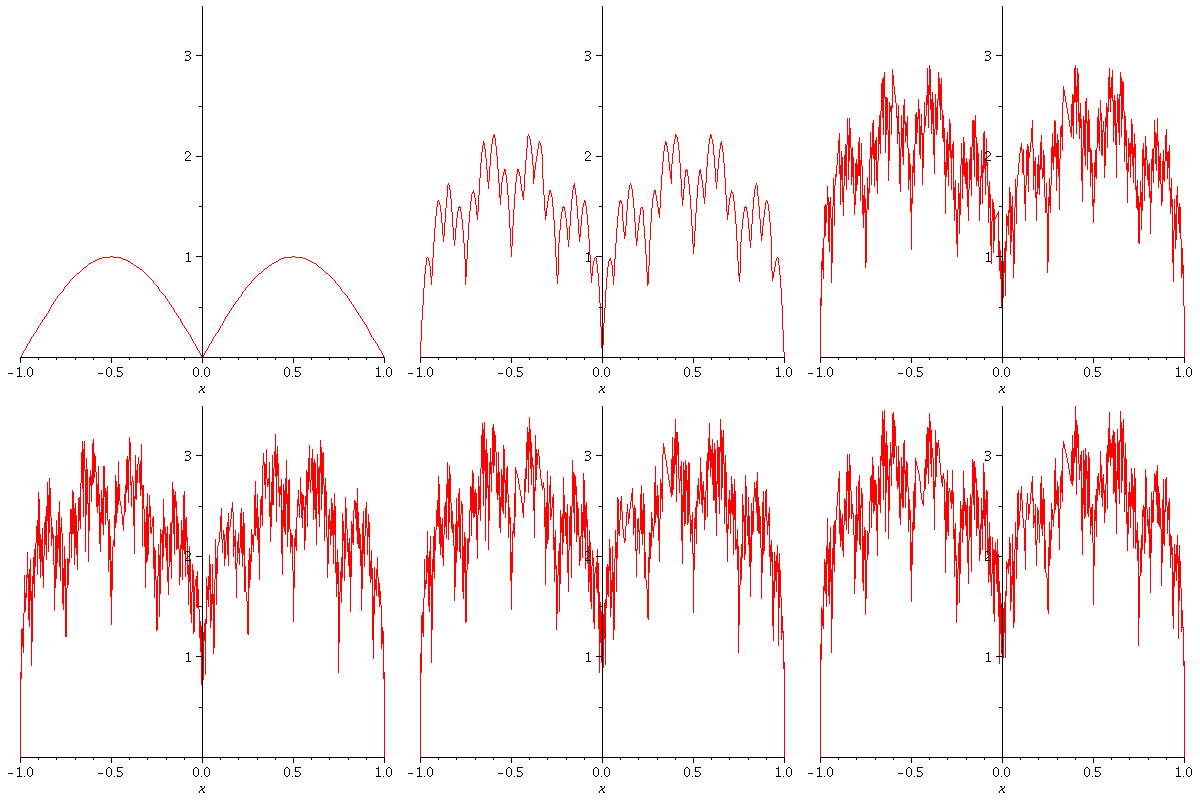
Below, let's graph, with domain [-d, d],
S_0, S_1, S_2, .... S_enough
all on the same grid in a fancy
"animated" effect with the S_n's
forming a "moving picture". I set
the speed at 1 frame per second
so it will take (enough+1) seconds to show
you S_0 through S_enough
| > |
| > | restart; with(plots):
a := 3/4 ; b := 4 ; d := 1 ; enough := 10 ; c := k->a^k*abs(sin(b^k*Pi*x)); S:=Sum(c(k), k=0..n); q1:=[seq(S, n=0..enough)]: q2:=[seq(plot(g,x=-d..d),g=q1)]: display(q2,insequence=true); |
 |
| > |
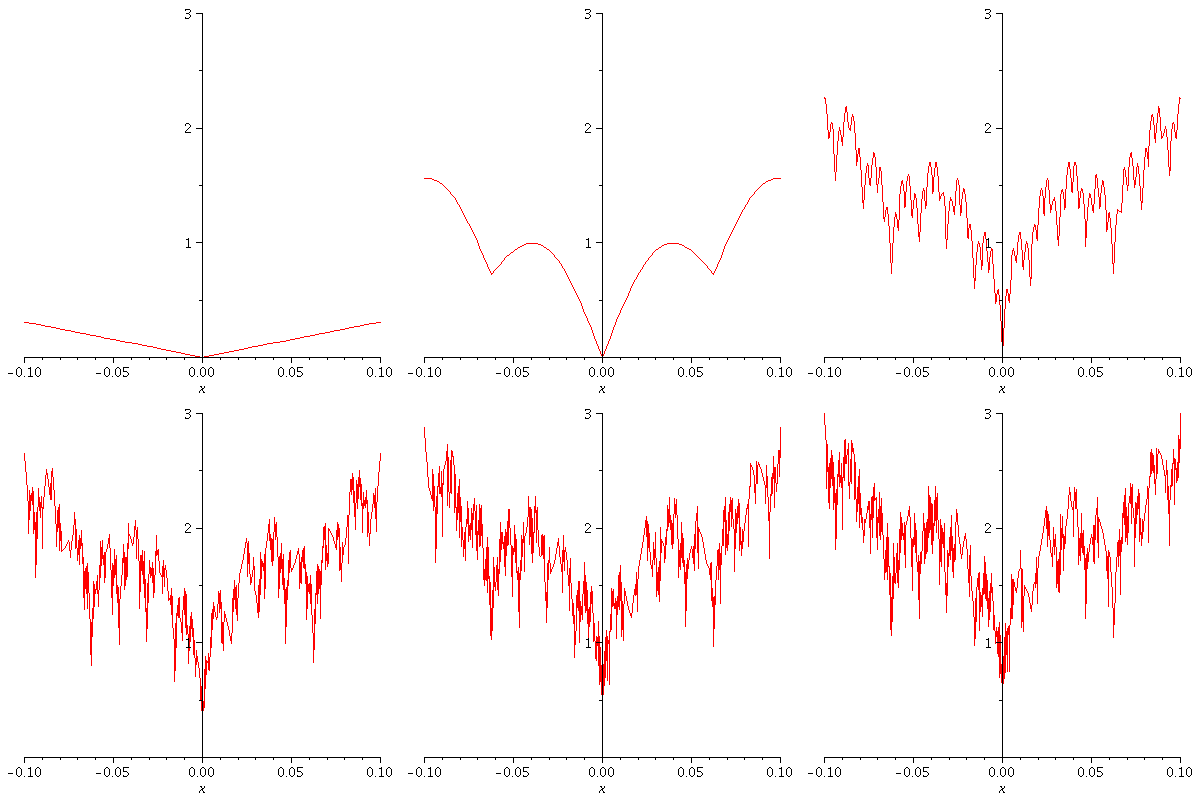
Let's do a "zoom" by changing the domain.
| > |
| > | restart; with(plots):
a := 3/4 ; b := 4 ; d := 0.1 ; enough := 10 ; c := k->a^k*abs(sin(b^k*Pi*x)); S:=Sum(c(k), k=0..n); q1:=[seq(S, n=0..enough)]: q2:=[seq(plot(g,x=-d..d),g=q1)]: display(q2,insequence=true); |
 |
| > |
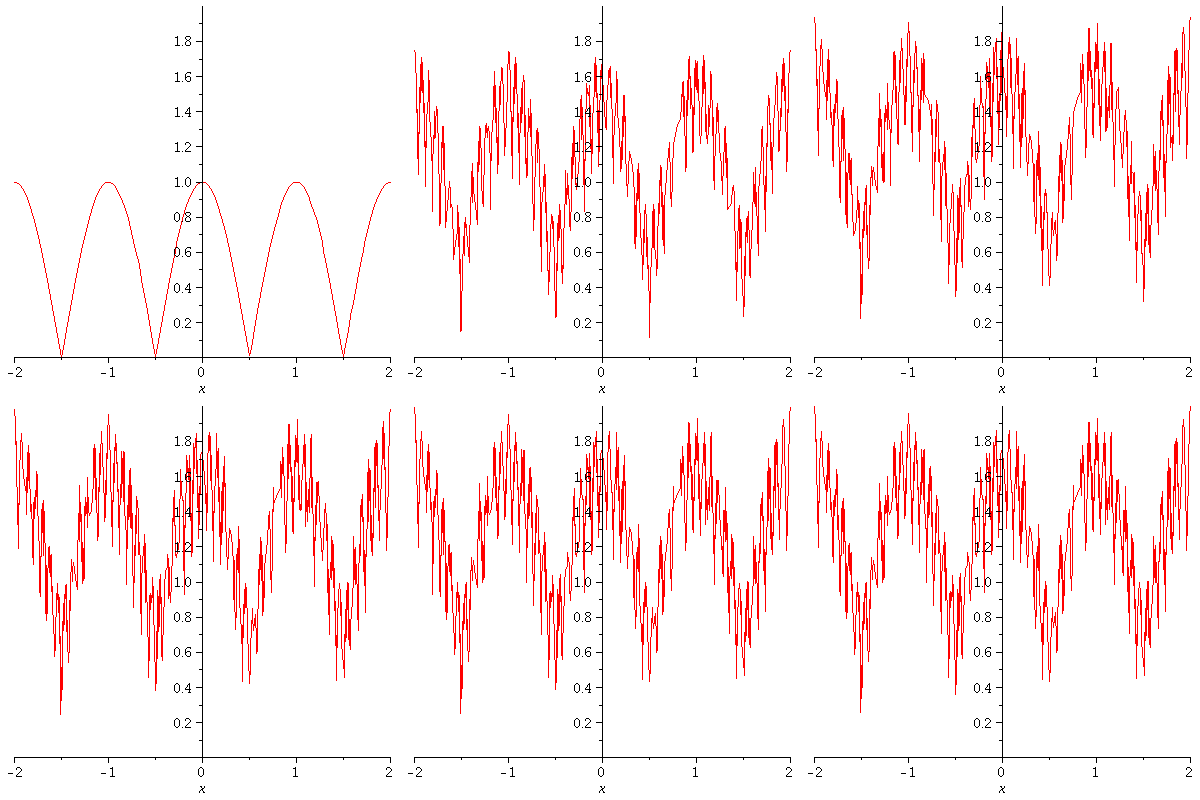
Here is Example 8.5.3 from Stoll's book.
| > | restart; with(plots):
a := 1/2 ; b := 13 ; d := 2; enough := 10 ; c := k->a^k*abs(cos(b^k*Pi*x)); S:=Sum(c(k), k=0..n); q1:=[seq(S, n=0..enough)]: q2:=[seq(plot(g,x=-d..d),g=q1)]: display(q2,insequence=true); |
 |
| > |
That's all!